RBS 2004 Annual Report Download - page 145
Download and view the complete annual report
Please find page 145 of the 2004 RBS annual report below. You can navigate through the pages in the report by either clicking on the pages listed below, or by using the keyword search tool below to find specific information within the annual report.-
 1
1 -
2
-
3
-
4
-
5
-
6
-
7
-
8
-
9
-
10
-
11
-
12
-
13
-
14
-
15
-
16
-
17
-
18
-
19
-
20
-
21
-
22
-
23
-
24
-
25
-
26
-
27
-
28
-
29
-
30
-
31
-
32
-
33
-
34
-
35
-
36
-
37
-
38
-
39
-
40
-
41
-
42
-
43
-
44
-
45
-
46
-
47
-
48
-
49
-
50
-
51
-
52
-
53
-
54
-
55
-
56
-
57
-
58
-
59
-
60
-
61
-
62
-
63
-
64
-
65
-
66
-
67
-
68
-
69
-
70
-
71
-
72
-
73
-
74
-
75
-
76
-
77
-
78
-
79
-
80
-
81
-
82
-
83
-
84
-
85
-
86
-
87
-
88
-
89
-
90
-
91
-
92
-
93
-
94
-
95
-
96
-
97
-
98
-
99
-
100
-
101
-
102
-
103
-
104
-
105
-
106
-
107
-
108
-
109
-
110
-
111
-
112
-
113
-
114
-
115
-
116
-
117
-
118
-
119
-
120
-
121
-
122
-
123
-
124
-
125
-
126
-
127
-
128
-
129
-
130
-
131
-
132
-
133
-
134
-
 135
135 -
 136
136 -
 137
137 -
 138
138 -
 139
139 -
 140
140 -
 141
141 -
 142
142 -
 143
143 -
 144
144 -
 145
145 -
 146
146 -
 147
147 -
 148
148 -
 149
149 -
 150
150 -
 151
151 -
 152
152 -
 153
153 -
 154
154 -
 155
155 -
156
-
157
-
158
-
159
-
160
-
161
-
162
-
163
-
164
-
165
-
166
-
167
-
168
-
169
-
170
-
171
-
172
-
173
-
174
-
175
-
176
-
177
-
178
-
179
-
180
-
181
-
182
-
183
-
184
-
185
-
186
-
187
-
188
-
189
-
190
-
191
-
192
-
193
-
194
-
195
-
196
-
197
-
198
-
199
-
200
-
201
-
202
-
203
-
204
-
205
-
206
-
207
-
208
-
209
-
210
-
211
-
212
-
213
-
214
-
215
-
216
-
217
-
218
-
219
-
220
-
221
-
222
-
223
-
224
-
225
-
226
-
227
-
228
-
229
-
230
-
231
-
232
-
233
-
234
 |
 |

section
03
143
Annual Report and Accounts 2004
Consolidated profit and loss account
Financial
statements
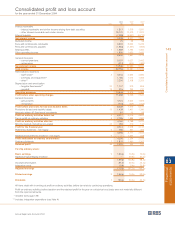
Consolidated profit and loss account
for the year ended 31 December 2004
2004 2003* 2002*
Note £m £m £m
Interest receivable
– interest receivable and similar income arising from debt securities 1,517 1,519 1,591
– other interest receivable and similar income 15,179 12,479 11,970
Interest payable (7,488) (5,697) (5,712)
Net interest income 9,208 8,301 7,849
Dividend income 79 58 58
Fees and commissions receivable 6,634 5,693 5,249
Fees and commissions payable (1,954) (1,337) (965)
Dealing profits 11,988 1,793 1,462
Other operating income 1,855 1,650 1,410
8,602 7,857 7,214
General insurance
– earned premiums 5,357 3,627 2,442
– reinsurance (413) (504) (489)
Non-interest income 13,546 10,980 9,167
Total income 22,754 19,281 17,016
Administrative expenses
– staff costs** 25,344 4,653 4,584
– premises and equipment** 1,184 1,073 1,006
– other** 2,296 2,108 2,253
Depreciation and amortisation
– tangible fixed assets** 20 1,107 919 895
– goodwill 19 915 763 731
Operating expenses 10,846 9,516 9,469
Profit before other operating charges 11,908 9,765 7,547
General insurance
– gross claims 3,724 2,644 1,693
– reinsurance (244) (449) (343)
Profit before provisions for bad and doubtful debts 8,428 7,570 6,197
Provisions for bad and doubtful debts 13 1,428 1,461 1,286
Amounts written off fixed asset investments 83 33 59
Profit on ordinary activities before tax 46,917 6,076 4,852
Tax on profit on ordinary activities 52,155 1,888 1,582
Profit on ordinary activities after tax 4,762 4,188 3,270
Minority interests (including non-equity) 32 250 210 133
Profit for the financial year 4,512 3,978 3,137
Preference dividends – non-equity 6256 261 305
4,256 3,717 2,832
Additional Value Shares dividend – non-equity 6—1,463 798
Profit attributable to ordinary shareholders 4,256 2,254 2,034
Ordinary dividends 71,837 1,490 1,267
Retained profit 34 2,419 764 767
Per 25p ordinary share:
Basic earnings 9138.0p 76.9p 70.6p
Additional Value Shares dividend — 49.9p 27.7p
138.0p 126.8p 98.3p
Goodwill amortisation 28.7p 25.0p 24.2p
Integration costs 5.8p 5.4p 23.8p
Adjusted earnings 172.5p 157.2p 146.3p
Diluted earnings 9136.9p 76.3p 69.6p
Dividends 758.0p 50.3p 43.7p
All items dealt with in arriving at profit on ordinary activities before tax relate to continuing operations.
Profit on ordinary activities before taxation and the retained profit for the year on a historical cost basis were not materially different
from the reported amounts.
* restated (see page 139)
** includes integration expenditure (see Note 4)