RBS 2004 Annual Report Download - page 176
Download and view the complete annual report
Please find page 176 of the 2004 RBS annual report below. You can navigate through the pages in the report by either clicking on the pages listed below, or by using the keyword search tool below to find specific information within the annual report.-
 1
1 -
2
-
3
-
4
-
5
-
6
-
7
-
8
-
9
-
10
-
11
-
12
-
13
-
14
-
15
-
16
-
17
-
18
-
19
-
20
-
21
-
22
-
23
-
24
-
25
-
26
-
27
-
28
-
29
-
30
-
31
-
32
-
33
-
34
-
35
-
36
-
37
-
38
-
39
-
40
-
41
-
42
-
43
-
44
-
45
-
46
-
47
-
48
-
49
-
50
-
51
-
52
-
53
-
54
-
55
-
56
-
57
-
58
-
59
-
60
-
61
-
62
-
63
-
64
-
65
-
66
-
67
-
68
-
69
-
70
-
71
-
72
-
73
-
74
-
75
-
76
-
77
-
78
-
79
-
80
-
81
-
82
-
83
-
84
-
85
-
86
-
87
-
88
-
89
-
90
-
91
-
92
-
93
-
94
-
95
-
96
-
97
-
98
-
99
-
100
-
101
-
102
-
103
-
104
-
105
-
106
-
107
-
108
-
109
-
110
-
111
-
112
-
113
-
114
-
115
-
116
-
117
-
118
-
119
-
120
-
121
-
122
-
123
-
124
-
125
-
126
-
127
-
128
-
129
-
130
-
131
-
132
-
133
-
134
-
135
-
136
-
137
-
138
-
139
-
140
-
141
-
142
-
143
-
144
-
145
-
146
-
147
-
148
-
149
-
150
-
151
-
152
-
153
-
154
-
155
-
156
-
157
-
158
-
159
-
160
-
161
-
162
-
163
-
164
-
165
-
 166
166 -
 167
167 -
 168
168 -
 169
169 -
 170
170 -
 171
171 -
 172
172 -
 173
173 -
 174
174 -
 175
175 -
 176
176 -
 177
177 -
 178
178 -
 179
179 -
 180
180 -
 181
181 -
 182
182 -
 183
183 -
 184
184 -
 185
185 -
 186
186 -
187
-
188
-
189
-
190
-
191
-
192
-
193
-
194
-
195
-
196
-
197
-
198
-
199
-
200
-
201
-
202
-
203
-
204
-
205
-
206
-
207
-
208
-
209
-
210
-
211
-
212
-
213
-
214
-
215
-
216
-
217
-
218
-
219
-
220
-
221
-
222
-
223
-
224
-
225
-
226
-
227
-
228
-
229
-
230
-
231
-
232
-
233
-
234
 |
 |
174
Notes on the accounts
Notes on the accounts continued
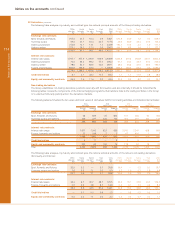
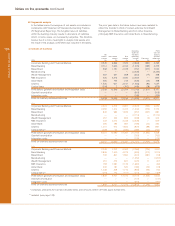
39 Derivatives (continued)
The following table analyses, by maturity and contract type, the notional principal amounts of the Group’s trading derivatives:
Within One to Two to Over 2004 Within One to Two to Over 2003
one year two years five years five years Total one year two years five years five years Total
£bn £bn £bn £bn £bn £bn £bn £bn £bn £bn
Exchange rate contracts:
Spot, forwards and futures 707.5 27.7 10.4 0.5 746.1 616.8 24.9 7.2 0.2 649.1
Currency swaps 49.5 31.1 54.3 42.7 177.6 43.5 26.0 43.4 33.3 146.2
Options purchased 214.9 13.1 13.1 1.7 242.8 156.1 10.5 4.1 1.0 171.7
Options written 223.1 19.2 12.3 1.6 256.2 164.7 8.5 3.4 1.1 177.7
1,195.0 91.1 90.1 46.5 1,422.7 981.1 69.9 58.1 35.6 1,144.7
Interest rate contracts:
Interest rate swaps 1,797.1 977.9 1,236.9 926.9 4,938.8 1,555.8 675.6 960.8 630.1 3,822.3
Options purchased 74.4 55.4 89.2 77.3 296.3 91.1 34.2 49.3 50.4 225.0
Options written 78.6 52.0 82.5 74.0 287.1 48.0 36.6 47.0 48.5 180.1
Futures and forwards 823.9 199.9 67.0 — 1,090.8 865.3 159.3 55.3 0.5 1,080.4
2,774.0 1,285.2 1,475.6 1,078.2 6,613.0 2,560.2 905.7 1,112.4 729.5 5,307.8
Credit derivatives 5.1 4.1 32.3 17.7 59.2 7.1 1.7 11.9 7.8 28.5
Equity and commodity contracts 24.3 7.5 11.4 0.2 43.4 20.4 5.3 8.2 0.2 34.1
Non-trading derivatives
The Group establishes non-trading derivatives positions externally with third parties and also internally. It should be noted that the
following tables include the components of the internal hedging programme that transfers risks to the trading portfolios in the Group
or to external third party participants in the derivatives markets.
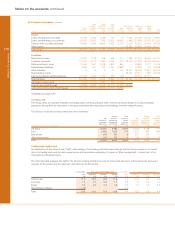
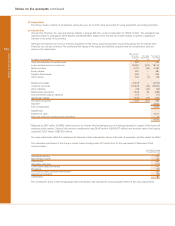
The following table summarises the fair values and book values of derivatives held for non-trading activities and includes internal trades:
2004 2004 2003 2003
Fair value Book value Fair value Book value
Positive Negative Positive Negative Positive Negative Positive Negative
£m £m £m £m £m £m £m £m
Exchange rate contracts:
Spot, forwards and futures 46 665 35 603 101 464 94 460
Currency swaps and options 349 227 234 123 304 210 224 135
395 892 269 726 405 674 318 595
Interest rate contracts:
Interest rate swaps 1,617 1,342 623 650 2,541 2,247 608 683
Futures, forwards and options 71 318 2 2 62 416 1 2
1,688 1,660 625 652 2,603 2,663 609 685
Credit derivatives 411— 6 36——
Equity and commodity contracts 207 62 102 15 118 52 78 22
Total 2,294 2,625 996 1,399 3,129 3,395 1,005 1,302
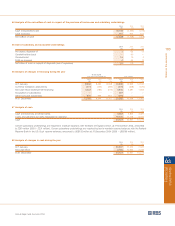
The following table analyses, by maturity and contract type, the notional principal amounts of the Group’s non-trading derivatives
(third party and internal):
Within One to Two to Over 2004 Within One to Two to Over 2003
one year two years five years five years Total one year two years five years five years Total
£bn £bn £bn £bn £bn £bn £bn £bn £bn £bn
Exchange rate contracts:
Spot, forwards and futures 20.5 0.2 — 0.1 20.8 19.4 — 0.2 0.1 19.7
Currency swaps and options 1.6 0.3 1.1 2.0 5.0 3.2 1.0 0.7 1.9 6.8
22.1 0.5 1.1 2.1 25.8 22.6 1.0 0.9 2.0 26.5
Interest rate contracts:
Interest rate swaps 34.4 6.7 30.7 48.7 120.5 34.4 15.1 33.5 43.7 126.7
Futures, forwards and options 0.9 0.2 3.8 8.7 13.6 0.4 0.1 3.3 4.6 8.4
35.3 6.9 34.5 57.4 134.1 34.8 15.2 36.8 48.3 135.1
Credit derivatives — 0.1 0.3 0.8 1.2 — 0.5 0.2 0.3 1.0
Equity and commodity contracts 0.4 0.2 1.1 0.6 2.3 0.3 0.5 0.7 0.2 1.7