RBS 2004 Annual Report Download - page 110
Download and view the complete annual report
Please find page 110 of the 2004 RBS annual report below. You can navigate through the pages in the report by either clicking on the pages listed below, or by using the keyword search tool below to find specific information within the annual report.-
 1
1 -
2
-
3
-
4
-
5
-
6
-
7
-
8
-
9
-
10
-
11
-
12
-
13
-
14
-
15
-
16
-
17
-
18
-
19
-
20
-
21
-
22
-
23
-
24
-
25
-
26
-
27
-
28
-
29
-
30
-
31
-
32
-
33
-
34
-
35
-
36
-
37
-
38
-
39
-
40
-
41
-
42
-
43
-
44
-
45
-
46
-
47
-
48
-
49
-
50
-
51
-
52
-
53
-
54
-
55
-
56
-
57
-
58
-
59
-
60
-
61
-
62
-
63
-
64
-
65
-
66
-
67
-
68
-
69
-
70
-
71
-
72
-
73
-
74
-
75
-
76
-
77
-
78
-
79
-
80
-
81
-
82
-
83
-
84
-
85
-
86
-
87
-
88
-
89
-
90
-
91
-
92
-
93
-
94
-
95
-
96
-
97
-
98
-
99
-
 100
100 -
 101
101 -
 102
102 -
 103
103 -
 104
104 -
 105
105 -
 106
106 -
 107
107 -
 108
108 -
 109
109 -
 110
110 -
 111
111 -
 112
112 -
 113
113 -
 114
114 -
 115
115 -
 116
116 -
 117
117 -
 118
118 -
 119
119 -
 120
120 -
121
-
122
-
123
-
124
-
125
-
126
-
127
-
128
-
129
-
130
-
131
-
132
-
133
-
134
-
135
-
136
-
137
-
138
-
139
-
140
-
141
-
142
-
143
-
144
-
145
-
146
-
147
-
148
-
149
-
150
-
151
-
152
-
153
-
154
-
155
-
156
-
157
-
158
-
159
-
160
-
161
-
162
-
163
-
164
-
165
-
166
-
167
-
168
-
169
-
170
-
171
-
172
-
173
-
174
-
175
-
176
-
177
-
178
-
179
-
180
-
181
-
182
-
183
-
184
-
185
-
186
-
187
-
188
-
189
-
190
-
191
-
192
-
193
-
194
-
195
-
196
-
197
-
198
-
199
-
200
-
201
-
202
-
203
-
204
-
205
-
206
-
207
-
208
-
209
-
210
-
211
-
212
-
213
-
214
-
215
-
216
-
217
-
218
-
219
-
220
-
221
-
222
-
223
-
224
-
225
-
226
-
227
-
228
-
229
-
230
-
231
-
232
-
233
-
234
 |
 |

108
Operating and financial review
Operating and financial review continued
Market risk
The Group is exposed to market risk because of positions held
in its trading portfolios and its non-trading business including
the Group’s treasury operations. The Group manages the
market risk in its trading and treasury portfolios through its
market risk management framework, which is based on value-
at-risk (“VaR”) limits, together with, but not limited to, stress
testing, scenario analysis, and position and sensitivity limits.
Stress testing measures the impact of abnormal changes in
market rates and prices on the fair value of the Group’s trading
portfolios. GEMC approves the high-level VaR and stress limits
for the Group. The Group market risk function, independent
from the Group’s trading businesses, is responsible for setting
and monitoring the adequacy and effectiveness of the Group’s
market risk management processes.
Value-at-risk
VaR is a technique that produces estimates of the potential
negative change in the market value of a portfolio over a
specified time horizon at given confidence levels. For internal
risk management purposes, the Group’s VaR assumes a time
horizon of one day and a confidence level of 95%. The Group
uses historical simulation models in computing VaR. This
approach, in common with many other VaR models, assumes
that risk factor changes observed in the past are a good
estimate of those likely to occur in the future and is, therefore,
limited by the relevance of the historical data used. The
Group’s method, however, does not make any assumption
about the nature or type of underlying loss distribution.
The Group typically uses the previous two years of market
data. The Group’s VaR should be interpreted in light of the
limitations of the methodology used. These limitations include:
•Historical data may not provide the best estimate of the joint
distribution of risk factor changes in the future and may fail
to capture the risk of possible extreme adverse market
movements which have not occurred in the historical window
used in the calculations.
•VaR using a one-day time horizon does not fully capture the
market risk of positions that cannot be liquidated or hedged
within one day.
•VaR using a 95% confidence level does not reflect the extent
of potential losses beyond that percentile.
The Group largely computes the VaR of trading portfolios at
the close of business and positions may change substantially
during the course of the trading day. Controls are in place to
limit the Group’s intra-day exposure; such as the calculation of
the VaR for selected portfolios. These limitations and the nature
of the VaR measure mean that the Group cannot guarantee
that losses will not exceed the VaR amounts indicated.
Trading
The principal focus of the Group’s trading activities is client
facilitation - providing products to the Group’s client base at
competitive prices. The Group also undertakes: market making
– quoting firm bid (buy) and offer (sell) prices with the intention
of profiting from the spread between the quotes; arbitrage –
entering into offsetting positions in different but closely related
markets in order to profit from market imperfections; and
proprietary activity – taking positions in financial instruments as
principal in order to take advantage of anticipated market
conditions. The main risk factors are interest rates, credit
spreads and foreign exchange. Financial instruments held in
the Group’s trading portfolios include, but are not limited to,
debt securities, loans, deposits, securities sale and repurchase
agreements and derivative financial instruments (futures,
forwards, swaps and options). For a discussion of the Group’s
accounting policies for, and information with respect to, its
exposures to derivative financial instruments, see Accounting
policies and Note 39 on the accounts.
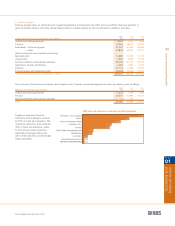
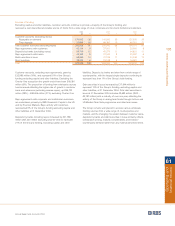
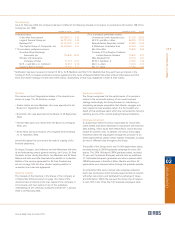
2004 2003
Average Period end Maximum Minimum Average Period end Maximum Minimum
£m £m £m £m £m £m £m £m
Trading
Interest rate 11.5 11.2 16.5 6.9 9.4 7.4 14.5 5.7
Currency 1.1 1.2 2.7 0.5 1.3 0.8 2.5 0.7
Equity 0.6 0.2 2.0 0.2 0.5 0.4 1.4 0.2
Diversification (2.3) (1.2)
Total trading VaR 10.8 10.3 16.0 6.4 9.4 7.4 14.2 5.6
The VaR for the Group’s trading portfolios segregated by type of market risk exposure is presented in the table below.