RBS 2004 Annual Report Download - page 101
Download and view the complete annual report
Please find page 101 of the 2004 RBS annual report below. You can navigate through the pages in the report by either clicking on the pages listed below, or by using the keyword search tool below to find specific information within the annual report.-
 1
1 -
2
-
3
-
4
-
5
-
6
-
7
-
8
-
9
-
10
-
11
-
12
-
13
-
14
-
15
-
16
-
17
-
18
-
19
-
20
-
21
-
22
-
23
-
24
-
25
-
26
-
27
-
28
-
29
-
30
-
31
-
32
-
33
-
34
-
35
-
36
-
37
-
38
-
39
-
40
-
41
-
42
-
43
-
44
-
45
-
46
-
47
-
48
-
49
-
50
-
51
-
52
-
53
-
54
-
55
-
56
-
57
-
58
-
59
-
60
-
61
-
62
-
63
-
64
-
65
-
66
-
67
-
68
-
69
-
70
-
71
-
72
-
73
-
74
-
75
-
76
-
77
-
78
-
79
-
80
-
81
-
82
-
83
-
84
-
85
-
86
-
87
-
88
-
89
-
90
-
 91
91 -
 92
92 -
 93
93 -
 94
94 -
 95
95 -
 96
96 -
 97
97 -
 98
98 -
 99
99 -
 100
100 -
 101
101 -
 102
102 -
 103
103 -
 104
104 -
 105
105 -
 106
106 -
 107
107 -
 108
108 -
 109
109 -
 110
110 -
 111
111 -
112
-
113
-
114
-
115
-
116
-
117
-
118
-
119
-
120
-
121
-
122
-
123
-
124
-
125
-
126
-
127
-
128
-
129
-
130
-
131
-
132
-
133
-
134
-
135
-
136
-
137
-
138
-
139
-
140
-
141
-
142
-
143
-
144
-
145
-
146
-
147
-
148
-
149
-
150
-
151
-
152
-
153
-
154
-
155
-
156
-
157
-
158
-
159
-
160
-
161
-
162
-
163
-
164
-
165
-
166
-
167
-
168
-
169
-
170
-
171
-
172
-
173
-
174
-
175
-
176
-
177
-
178
-
179
-
180
-
181
-
182
-
183
-
184
-
185
-
186
-
187
-
188
-
189
-
190
-
191
-
192
-
193
-
194
-
195
-
196
-
197
-
198
-
199
-
200
-
201
-
202
-
203
-
204
-
205
-
206
-
207
-
208
-
209
-
210
-
211
-
212
-
213
-
214
-
215
-
216
-
217
-
218
-
219
-
220
-
221
-
222
-
223
-
224
-
225
-
226
-
227
-
228
-
229
-
230
-
231
-
232
-
233
-
234
 |
 |
section
01
99
Annual Report and Accounts 2004
Operating and financial review
Operating and
financial review
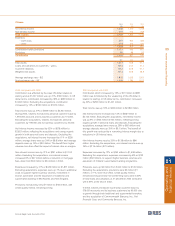
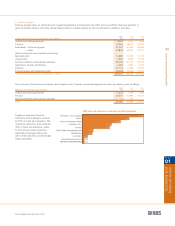
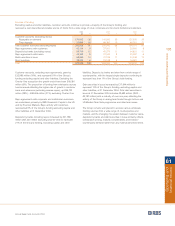
2004 2003 2002
Loans and advances to customers by industry £m £m £m
Central and local government 3,079 2,100 2,385
Finance 70,453 38,936 34,079
Individuals – home mortgages 91,657 61,960 49,986
– other 43,875 35,027 30,021
Other commercial and industrial comprising:
Manufacturing 14,883 12,769 14,715
Construction 7,976 5,839 5,152
Service industries and business activities 57,305 50,772 48,155
Agriculture, forestry and fishing 3,024 3,081 3,026
Property 41,113 31,629 26,593
Finance leases and instalment credit 16,326 14,340 13,132
Total loans and advances to customers – gross 349,691 256,453 227,244
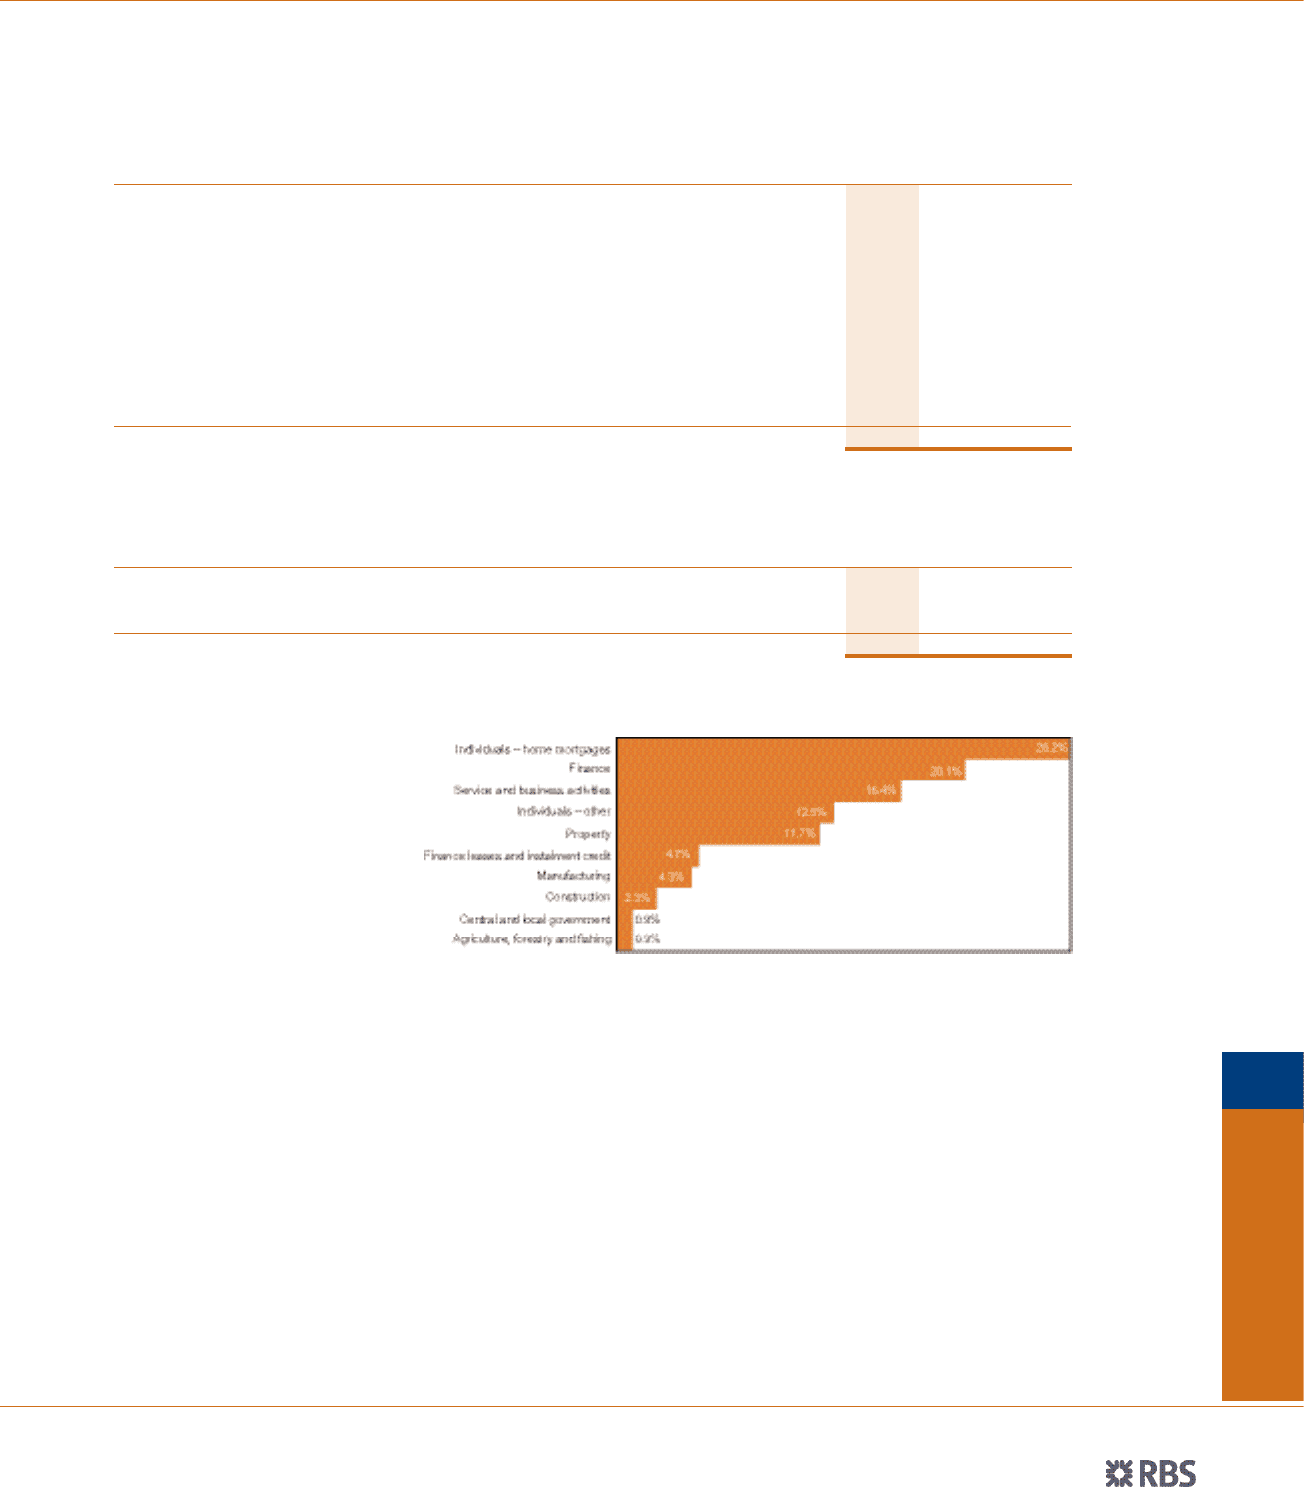
lIndustry analysis
Industry analysis plays an important part in assessing potential concentration risk within the loan portfolio. Particular attention is
given to industry sectors where the Group believes there is a higher degree of risk or potential for volatility in the future.
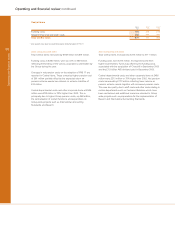
Together, corporates, financial
institutions and sovereigns, account
for 61% of loans and advances. The
remaining exposures, accounting for
39% of loans and advances, relate
to personal and retail customers,
especially mortgage lending and
other small loans that are intrinsically
highly diversified.
2004 loans and advances to customers by industry segment
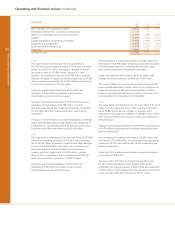
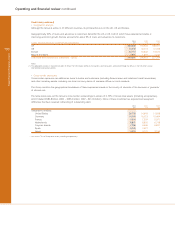
The increase in Finance was principally due to higher level of reverse repurchase agreements which by industry were as follows:
2004 2003 2002
Reverse repurchase agreements £m £m £m
Central and local government 1,413 1,079 1,000
Finance 50,771 22,883 20,941
Service industries and business activities — 107 —
Total 52,184 24,069 21,941