RBS 2004 Annual Report Download - page 152
Download and view the complete annual report
Please find page 152 of the 2004 RBS annual report below. You can navigate through the pages in the report by either clicking on the pages listed below, or by using the keyword search tool below to find specific information within the annual report.-
 1
1 -
2
-
3
-
4
-
5
-
6
-
7
-
8
-
9
-
10
-
11
-
12
-
13
-
14
-
15
-
16
-
17
-
18
-
19
-
20
-
21
-
22
-
23
-
24
-
25
-
26
-
27
-
28
-
29
-
30
-
31
-
32
-
33
-
34
-
35
-
36
-
37
-
38
-
39
-
40
-
41
-
42
-
43
-
44
-
45
-
46
-
47
-
48
-
49
-
50
-
51
-
52
-
53
-
54
-
55
-
56
-
57
-
58
-
59
-
60
-
61
-
62
-
63
-
64
-
65
-
66
-
67
-
68
-
69
-
70
-
71
-
72
-
73
-
74
-
75
-
76
-
77
-
78
-
79
-
80
-
81
-
82
-
83
-
84
-
85
-
86
-
87
-
88
-
89
-
90
-
91
-
92
-
93
-
94
-
95
-
96
-
97
-
98
-
99
-
100
-
101
-
102
-
103
-
104
-
105
-
106
-
107
-
108
-
109
-
110
-
111
-
112
-
113
-
114
-
115
-
116
-
117
-
118
-
119
-
120
-
121
-
122
-
123
-
124
-
125
-
126
-
127
-
128
-
129
-
130
-
131
-
132
-
133
-
134
-
135
-
136
-
137
-
138
-
139
-
140
-
141
-
 142
142 -
 143
143 -
 144
144 -
 145
145 -
 146
146 -
 147
147 -
 148
148 -
 149
149 -
 150
150 -
 151
151 -
 152
152 -
 153
153 -
 154
154 -
 155
155 -
 156
156 -
 157
157 -
 158
158 -
 159
159 -
 160
160 -
 161
161 -
 162
162 -
163
-
164
-
165
-
166
-
167
-
168
-
169
-
170
-
171
-
172
-
173
-
174
-
175
-
176
-
177
-
178
-
179
-
180
-
181
-
182
-
183
-
184
-
185
-
186
-
187
-
188
-
189
-
190
-
191
-
192
-
193
-
194
-
195
-
196
-
197
-
198
-
199
-
200
-
201
-
202
-
203
-
204
-
205
-
206
-
207
-
208
-
209
-
210
-
211
-
212
-
213
-
214
-
215
-
216
-
217
-
218
-
219
-
220
-
221
-
222
-
223
-
224
-
225
-
226
-
227
-
228
-
229
-
230
-
231
-
232
-
233
-
234
 |
 |
150
Notes on the accounts
Notes on the accounts continued
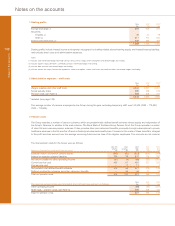
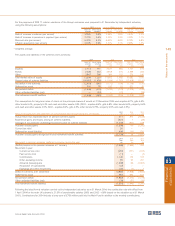
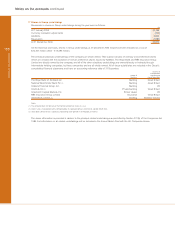
3 Pension costs (continued)
2004 2003 2002
History of experience gains and losses £m £m £m
Difference between expected and actual return on scheme assets:
Amount 411 872 (2,645)
Percentage of scheme assets 2.8% 6.8% (22.6%)
Experience gains and losses on scheme liabilities:
Amount (631) 7(25)
Percentage of the present value of scheme liabilities (3.6%) — (0.2%)
Total amount recognised in the statement of total recognised gains and losses:
Amount (1,598) 69 (2,392)
Percentage of the present value of scheme liabilities (9.0%) 0.5% (17.7%)
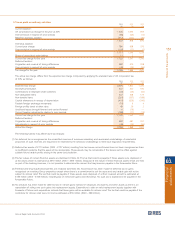
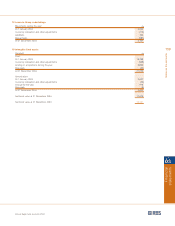
4 Profit on ordinary activities before tax
Profit on ordinary activities before tax is stated after taking account of the following:
2004 2003 2002
£m £m £m
Income Aggregate amounts receivable under finance leases,
hire purchase and conditional sale contracts 1,345 1,161 1,342
Aggregate amounts receivable under operating leases 1,103 939 811
Profit on disposal of investment securities 167 172 85
Share of associated undertakings’ net profit 35 12 2
Expenses Operating lease rentals of premises 338 321 255
Operating lease rentals of computers and other equipment 15 13 16
Finance charges on leased assets 13 823
Interest on subordinated liabilities 681 551 659
Integration expenditure* relating to:
– acquisition of NatWest — 143 810
– other acquisitions 269 86 147
* Integration expenditure comprises:
Staff costs 113 125 530
Premises and equipment 34 31 127
Other administrative expenses 120 73 298
Depreciation 2—2
269 229 957
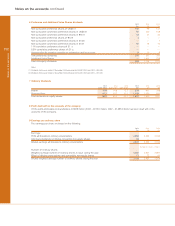
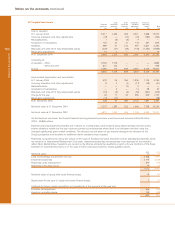
Auditors’ remuneration
Amounts paid to the auditors for statutory audit and other services were as follows:
2004 2003
£m £m
Audit services
– Statutory audit 8.2 7.2
– Audit related regulatory reporting 1.1 0.6
9.3 7.8
Further assurance services 3.0 5.7
Tax services
– Compliance services 0.2 0.1
– Advisory services 0.2 0.5
0.4 0.6
Other services 3.0 0.7
Total 15.7 14.8
The auditors’ remuneration for statutory audit work for the company was £0.1 million (2003 – £0.1 million). Non–audit fees paid to the
auditors and their associates in the UK was £6.4 million (2003 – £6.2 million).