RBS 2004 Annual Report Download - page 90
Download and view the complete annual report
Please find page 90 of the 2004 RBS annual report below. You can navigate through the pages in the report by either clicking on the pages listed below, or by using the keyword search tool below to find specific information within the annual report.-
 1
1 -
2
-
3
-
4
-
5
-
6
-
7
-
8
-
9
-
10
-
11
-
12
-
13
-
14
-
15
-
16
-
17
-
18
-
19
-
20
-
21
-
22
-
23
-
24
-
25
-
26
-
27
-
28
-
29
-
30
-
31
-
32
-
33
-
34
-
35
-
36
-
37
-
38
-
39
-
40
-
41
-
42
-
43
-
44
-
45
-
46
-
47
-
48
-
49
-
50
-
51
-
52
-
53
-
54
-
55
-
56
-
57
-
58
-
59
-
60
-
61
-
62
-
63
-
64
-
65
-
66
-
67
-
68
-
69
-
70
-
71
-
72
-
73
-
74
-
75
-
76
-
77
-
78
-
79
-
 80
80 -
 81
81 -
 82
82 -
 83
83 -
 84
84 -
 85
85 -
 86
86 -
 87
87 -
 88
88 -
 89
89 -
 90
90 -
 91
91 -
 92
92 -
 93
93 -
 94
94 -
 95
95 -
 96
96 -
 97
97 -
 98
98 -
 99
99 -
 100
100 -
101
-
102
-
103
-
104
-
105
-
106
-
107
-
108
-
109
-
110
-
111
-
112
-
113
-
114
-
115
-
116
-
117
-
118
-
119
-
120
-
121
-
122
-
123
-
124
-
125
-
126
-
127
-
128
-
129
-
130
-
131
-
132
-
133
-
134
-
135
-
136
-
137
-
138
-
139
-
140
-
141
-
142
-
143
-
144
-
145
-
146
-
147
-
148
-
149
-
150
-
151
-
152
-
153
-
154
-
155
-
156
-
157
-
158
-
159
-
160
-
161
-
162
-
163
-
164
-
165
-
166
-
167
-
168
-
169
-
170
-
171
-
172
-
173
-
174
-
175
-
176
-
177
-
178
-
179
-
180
-
181
-
182
-
183
-
184
-
185
-
186
-
187
-
188
-
189
-
190
-
191
-
192
-
193
-
194
-
195
-
196
-
197
-
198
-
199
-
200
-
201
-
202
-
203
-
204
-
205
-
206
-
207
-
208
-
209
-
210
-
211
-
212
-
213
-
214
-
215
-
216
-
217
-
218
-
219
-
220
-
221
-
222
-
223
-
224
-
225
-
226
-
227
-
228
-
229
-
230
-
231
-
232
-
233
-
234
 |
 |

88
Operating and financial review
Operating and financial review continued
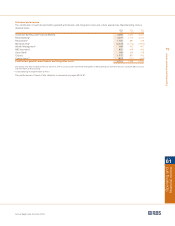
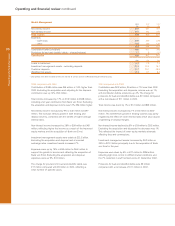
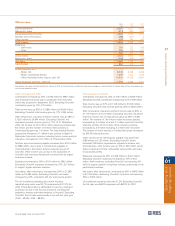
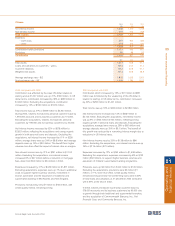
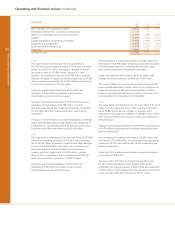
Ulster Bank
2004 2003* 2002*
£m £m £m
Net interest income 550 396 339
Non-interest income 193 185 181
Total income 743 581 520
Expenses
– staff costs 158 137 122
– other 77 58 58
235 195 180
Contribution before provisions 508 386 340
Provisions 40 32 22
Contribution 468 354 318
£bn £bn £bn
Total assets 27.4 15.6 12.7
Loans and advances to customers – gross
– mortgages 8.8 2.8 1.8
– other 12.9 8.8 7.3
Customer deposits 13.5 9.7 8.8
Weighted risk assets 18.5 11.0 9.0
Average exchange rate – /£ 1.474 1.445 1.591
Spot exchange rate – /£ 1.418 1.416 1.536
* prior periods have been restated to reflect the transfer in 2004 of certain activities to Manufacturing.
2004 compared with 2003
Contribution increased by 32% or £114 million to £468 million.
Total income increased by 28% or £162 million to £743 million
reflecting the acquisition of First Active and strong organic
growth, particularly in residential mortgages. Adjusting for First
Active and the disposal in October 2003 of NCB Stockbrokers
('NCB'), income increased by 12% at constant exchange rates.
During 2004, the number of customers increased by 454,000,
of which 374,000 relate to First Active.
Net interest income rose by 39% or £154 million to £550
million, reflecting strong growth across all customer lending
products and in customer deposits. Excluding First Active and
NCB and at constant exchange rates, net interest income
increased by 14%. The net interest margin decreased mainly
due to strong growth in low risk mortgage lending both organic
and due to the acquisition of First Active, a leading mortgage
provider in the Republic of Ireland. Underlying product
margins remain stable.
Non-interest income increased by £8 million, 4% to £193
million. Strong growth in lending fees and sales of treasury
products was partially offset by a reduction in brokerage fees
following the disposal of NCB. Excluding First Active and NCB,
non-interest income was up 6%, £10 million.
Expenses increased by 21% or £40 million to £235 million.
Excluding First Active and NCB expenses increased by 8% to
support the growth in business.
The charge for provisions for bad debts increased by £8 million
to £40 million, reflecting the growth in lending business.
Excluding First Active and NCB provisions for bad and doubtful
debts were up £4 million. Asset quality remains strong.
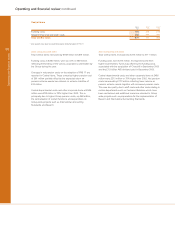
2003 compared with 2002
Contribution increased by 11% or £36 million to £354 million
driven by strong volume growth in both loan and deposit products.
The number of customers increased in 2003 by 36,000.
Total income increased by 12% or £61 million to £581 million
reflecting the strong volume growth, in particular residential
mortgages.
Net interest income rose by 17% or £57 million to £396 million,
reflecting strong growth in both average customer lending and
deposits which increased by 26% or £2.1 billion, to £10.1
billion and by 13% or £1.0 billion, to £8.9 billion respectively.
Non-interest income increased by £4 million to £185 million.
Strong growth in lending, transmission and card fee income
was partially offset by lower dealing profits. Uncertainty in
equity markets adversely affected brokerage fees in the
stockbroking business which was sold in October 2003.
Expenses increased by 8% or £15 million to £195 million. This
reflected the annual pay award and the additional costs to
support increased business volumes.
The charge for provisions for bad debts was up £10 million to
£32 million reflecting growth in lending.