RBS 2004 Annual Report Download - page 186
Download and view the complete annual report
Please find page 186 of the 2004 RBS annual report below. You can navigate through the pages in the report by either clicking on the pages listed below, or by using the keyword search tool below to find specific information within the annual report.-
 1
1 -
2
-
3
-
4
-
5
-
6
-
7
-
8
-
9
-
10
-
11
-
12
-
13
-
14
-
15
-
16
-
17
-
18
-
19
-
20
-
21
-
22
-
23
-
24
-
25
-
26
-
27
-
28
-
29
-
30
-
31
-
32
-
33
-
34
-
35
-
36
-
37
-
38
-
39
-
40
-
41
-
42
-
43
-
44
-
45
-
46
-
47
-
48
-
49
-
50
-
51
-
52
-
53
-
54
-
55
-
56
-
57
-
58
-
59
-
60
-
61
-
62
-
63
-
64
-
65
-
66
-
67
-
68
-
69
-
70
-
71
-
72
-
73
-
74
-
75
-
76
-
77
-
78
-
79
-
80
-
81
-
82
-
83
-
84
-
85
-
86
-
87
-
88
-
89
-
90
-
91
-
92
-
93
-
94
-
95
-
96
-
97
-
98
-
99
-
100
-
101
-
102
-
103
-
104
-
105
-
106
-
107
-
108
-
109
-
110
-
111
-
112
-
113
-
114
-
115
-
116
-
117
-
118
-
119
-
120
-
121
-
122
-
123
-
124
-
125
-
126
-
127
-
128
-
129
-
130
-
131
-
132
-
133
-
134
-
135
-
136
-
137
-
138
-
139
-
140
-
141
-
142
-
143
-
144
-
145
-
146
-
147
-
148
-
149
-
150
-
151
-
152
-
153
-
154
-
155
-
156
-
157
-
158
-
159
-
160
-
161
-
162
-
163
-
164
-
165
-
166
-
167
-
168
-
169
-
170
-
171
-
172
-
173
-
174
-
175
-
 176
176 -
 177
177 -
 178
178 -
 179
179 -
 180
180 -
 181
181 -
 182
182 -
 183
183 -
 184
184 -
 185
185 -
 186
186 -
 187
187 -
 188
188 -
 189
189 -
 190
190 -
 191
191 -
 192
192 -
 193
193 -
 194
194 -
 195
195 -
 196
196 -
197
-
198
-
199
-
200
-
201
-
202
-
203
-
204
-
205
-
206
-
207
-
208
-
209
-
210
-
211
-
212
-
213
-
214
-
215
-
216
-
217
-
218
-
219
-
220
-
221
-
222
-
223
-
224
-
225
-
226
-
227
-
228
-
229
-
230
-
231
-
232
-
233
-
234
 |
 |

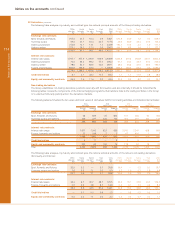
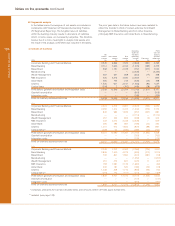
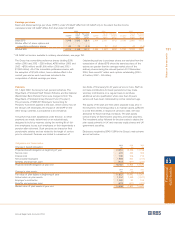
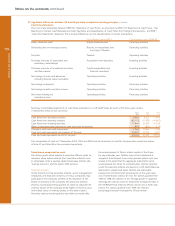
a) Classes of business
Operating Profit/
expenses (loss) on
Net and other ordinary
interest Non-interest Total operating activities
income income income charges Provisions* before tax
2004 £m £m £m £m £m £m
Corporate Banking and Financial Markets 2,545 4,964 7,509 (2,664) (580) 4,265
Retail Banking 3,112 1,630 4,742 (1,074) (389) 3,279
Retail Direct 938 1,191 2,129 (712) (377) 1,040
Manufacturing –– –– –– (2,439) –– (2,439)
Wealth Management 497 451 948 (463) (17) 468
RBS Insurance 420 4,514 4,934 (4,072) –– 862
Ulster Bank 550 193 743 (235) (40) 468
Citizens 1,540 601 2,141 (1,024) (80) 1,037
Central items (394) 2 (392) (459) (28) (879)
Profit before goodwill amortisation and integration costs 9,208 13,546 22,754 (13,142) (1,511) 8,101
Goodwill amortisation –– –– –– (915) –– (915)
Integration costs –– –– –– (269) –– (269)
Profit on ordinary activities before tax 9,208 13,546 22,754 (14,326) (1,511) 6,917
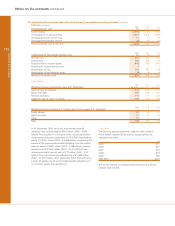
2003
Corporate Banking and Financial Markets 2,324 4,373 6,697 (2,322) (755) 3,620
Retail Banking 2,959 1,514 4,473 (1,030) (273) 3,170
Retail Direct 849 986 1,835 (657) (297) 881
Manufacturing — — — (2,114) — (2,114)
Wealth Management 457 352 809 (398) (9) 402
RBS Insurance 232 3,013 3,245 (2,636) — 609
Ulster Bank 396 185 581 (195) (32) 354
Citizens 1,310 514 1,824 (879) (88) 857
Central items** (226) 43 (183) (488) (40) (711)
Profit before goodwill amortisation and integration costs 8,301 10,980 19,281 (10,719) (1,494) 7,068
Goodwill amortisation — — — (763) — (763)
Integration costs — — — (229) — (229)
Profit on ordinary activities before tax 8,301 10,980 19,281 (11,711) (1,494) 6,076
2002
Corporate Banking and Financial Markets 2,349 3,703 6,052 (2,066) (725) 3,261
Retail Banking 2,849 1,430 4,279 (992) (213) 3,074
Retail Direct 749 841 1,590 (601) (281) 708
Manufacturing — — — (1,952) — (1,952)
Wealth Management 451 370 821 (425) 11 407
RBS Insurance 158 1,981 2,139 (1,683) — 456
Ulster Bank 339 181 520 (180) (22) 318
Citizens 1,248 468 1,716 (855) (95) 766
Central items** (294) 193 (101) (377) (20) (498)
Profit before goodwill amortisation and integration costs 7,849 9,167 17,016 (9,131) (1,345) 6,540
Goodwill amortisation — — — (731) — (731)
Integration costs — — — (957) — (957)
Profit on ordinary activities before tax 7,849 9,167 17,016 (10,819) (1,345) 4,852
* comprises provisions for bad and doubtful debts and amounts written off fixed asset investments.
** restated (see page 139).
184
Notes on the accounts
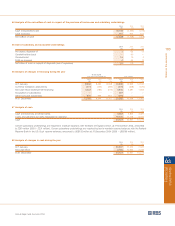
Notes on the accounts continued
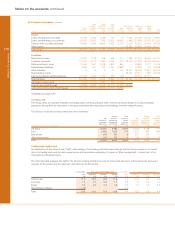
In the tables below, the analyses of net assets are included in
compliance with Statement of Standard Accounting Practice
25 ‘Segmental Reporting’. The fungible nature of liabilities
within the banking industry results in allocations of liabilities
which, in some cases, are necessarily subjective. The directors
believe that it is more meaningful to analyse total assets and
the result of this analysis is therefore also included in the tables.
The prior year data in the tables below have been restated to
reflect the transfer in 2004 of certain activities from Wealth
Management to Retail Banking and from other divisions,
principally RBS Insurance and Ulster Bank, to Manufacturing.
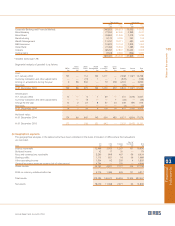
49 Segmental analysis