RBS 2004 Annual Report Download - page 86
Download and view the complete annual report
Please find page 86 of the 2004 RBS annual report below. You can navigate through the pages in the report by either clicking on the pages listed below, or by using the keyword search tool below to find specific information within the annual report.-
 1
1 -
2
-
3
-
4
-
5
-
6
-
7
-
8
-
9
-
10
-
11
-
12
-
13
-
14
-
15
-
16
-
17
-
18
-
19
-
20
-
21
-
22
-
23
-
24
-
25
-
26
-
27
-
28
-
29
-
30
-
31
-
32
-
33
-
34
-
35
-
36
-
37
-
38
-
39
-
40
-
41
-
42
-
43
-
44
-
45
-
46
-
47
-
48
-
49
-
50
-
51
-
52
-
53
-
54
-
55
-
56
-
57
-
58
-
59
-
60
-
61
-
62
-
63
-
64
-
65
-
66
-
67
-
68
-
69
-
70
-
71
-
72
-
73
-
74
-
75
-
 76
76 -
 77
77 -
 78
78 -
 79
79 -
 80
80 -
 81
81 -
 82
82 -
 83
83 -
 84
84 -
 85
85 -
 86
86 -
 87
87 -
 88
88 -
 89
89 -
 90
90 -
 91
91 -
 92
92 -
 93
93 -
 94
94 -
 95
95 -
 96
96 -
97
-
98
-
99
-
100
-
101
-
102
-
103
-
104
-
105
-
106
-
107
-
108
-
109
-
110
-
111
-
112
-
113
-
114
-
115
-
116
-
117
-
118
-
119
-
120
-
121
-
122
-
123
-
124
-
125
-
126
-
127
-
128
-
129
-
130
-
131
-
132
-
133
-
134
-
135
-
136
-
137
-
138
-
139
-
140
-
141
-
142
-
143
-
144
-
145
-
146
-
147
-
148
-
149
-
150
-
151
-
152
-
153
-
154
-
155
-
156
-
157
-
158
-
159
-
160
-
161
-
162
-
163
-
164
-
165
-
166
-
167
-
168
-
169
-
170
-
171
-
172
-
173
-
174
-
175
-
176
-
177
-
178
-
179
-
180
-
181
-
182
-
183
-
184
-
185
-
186
-
187
-
188
-
189
-
190
-
191
-
192
-
193
-
194
-
195
-
196
-
197
-
198
-
199
-
200
-
201
-
202
-
203
-
204
-
205
-
206
-
207
-
208
-
209
-
210
-
211
-
212
-
213
-
214
-
215
-
216
-
217
-
218
-
219
-
220
-
221
-
222
-
223
-
224
-
225
-
226
-
227
-
228
-
229
-
230
-
231
-
232
-
233
-
234
 |
 |

84
Operating and financial review
Operating and financial review continued
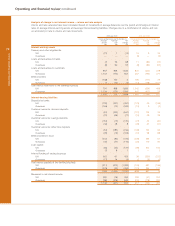
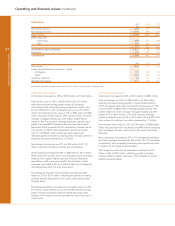
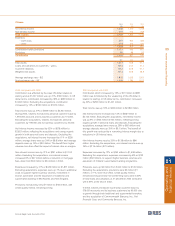
Retail Direct
2004 2003* 2002*
£m £m £m
Net interest income 938 849 749
Non-interest income 1,191 986 841
Total income 2,129 1,835 1,590
Direct expenses
– staff costs 259 211 190
– other 453 446 411
712 657 601
Contribution before provisions 1,417 1,178 989
Provisions 377 297 281
Contribution 1,040 881 708
£bn £bn £bn
Total assets 26.9 21.9 19.4
Loans and advances to customers – gross
– mortgages 9.2 8.2 7.0
– other 16.0 13.8 12.4
Customer deposits 4.4 4.4 4.4
Weighted risk assets 21.1 16.8 14.4
* prior periods have been restated to reflect the transfer in 2004 of certain activities to Manufacturing.
2004 compared with 2003
Contribution increased by 18% or £159 million to £1,040 million.
Total income was up 16% or £294 million to £2,129 million,
reflecting continued strong growth across all products,
particularly credit cards. Excluding acquisitions income rose
by 9%, £155 million, and contribution was up by 14%, £125
million. Net interest income was up 10% or £89 million to £938
million. Average lending rose by 19% to £24.2 billion, of which
average mortgage lending was 16% higher at £8.8 billion,
mainly in The One account. Average customer deposits were
stable. The new MINT branded credit card was launched in
December 2003 and while the 0% introductory interest rate for
nine months on MINT cards depressed net interest margin,
over 711,000 MINT credit cards have been issued and
attracted significant balances. During 2004, the total number of
customer accounts increased by 2.3 million.
Non-interest income was up 21% or £205 million to £1,191
million, reflecting increased volumes and acquisitions.
Direct expenses increased by 8% or £55 million to £712 million.
Staff costs were up 23%, due to the acquisitions and increased
headcount to support higher business volumes. Excluding
acquisitions, staff costs were up 8%. The increase in other
expenses was limited to 2%, as a result of tight cost management
and efficiencies within the core businesses.
The charge for provisions for bad debts increased by £80
million or 27% to £377 million, reflecting the growth in lending
volumes and the acquisition of the credit card business from
People's Bank.
Excluding acquisitions, provisions for bad debts were up 14%,
£41 million. Credit metrics across the portfolio remain broadly
stable, however consistent with the market there was some
increase in the levels of arrears towards the end of the year in
credit cards.
2003 compared with 2002
Contribution increased by 24% or £173 million to £881 million.
Total income was up 15% or £245 million to £1,835 million,
reflecting continued strong growth in supermarket banking
(TPF), mortgages and cards. Net interest income was up 13%
or £100 million to £849 million. Average lending rose by 15%
to £20.3 billion of which average mortgage lending was 20%
higher at £7.6 billion mainly in The One account. Average
customer deposits were up 5% to £4.4 billion. During 2003, the
total number of customer accounts increased by 1.7 million.
Non-interest income was up 17% or £145 million to £986 million.
There was good growth in insurance and ATM income resulting
from increased volumes, particularly in TPF and in the Cards
Business.
Direct expenses increased by 9% or 7% excluding acquisitions,
and other expenses increased by £35 million, 9% (7% excluding
acquisitions), with increased processing and operational costs
in support of the higher business levels.
The charge for provisions for bad debts increased by £16
million or 6% to £297 million, reflecting growth in lending
volumes offset by higher recoveries. The indicators of credit
quality remained stable.