RBS 2004 Annual Report Download - page 89
Download and view the complete annual report
Please find page 89 of the 2004 RBS annual report below. You can navigate through the pages in the report by either clicking on the pages listed below, or by using the keyword search tool below to find specific information within the annual report.-
 1
1 -
2
-
3
-
4
-
5
-
6
-
7
-
8
-
9
-
10
-
11
-
12
-
13
-
14
-
15
-
16
-
17
-
18
-
19
-
20
-
21
-
22
-
23
-
24
-
25
-
26
-
27
-
28
-
29
-
30
-
31
-
32
-
33
-
34
-
35
-
36
-
37
-
38
-
39
-
40
-
41
-
42
-
43
-
44
-
45
-
46
-
47
-
48
-
49
-
50
-
51
-
52
-
53
-
54
-
55
-
56
-
57
-
58
-
59
-
60
-
61
-
62
-
63
-
64
-
65
-
66
-
67
-
68
-
69
-
70
-
71
-
72
-
73
-
74
-
75
-
76
-
77
-
78
-
 79
79 -
 80
80 -
 81
81 -
 82
82 -
 83
83 -
 84
84 -
 85
85 -
 86
86 -
 87
87 -
 88
88 -
 89
89 -
 90
90 -
 91
91 -
 92
92 -
 93
93 -
 94
94 -
 95
95 -
 96
96 -
 97
97 -
 98
98 -
 99
99 -
100
-
101
-
102
-
103
-
104
-
105
-
106
-
107
-
108
-
109
-
110
-
111
-
112
-
113
-
114
-
115
-
116
-
117
-
118
-
119
-
120
-
121
-
122
-
123
-
124
-
125
-
126
-
127
-
128
-
129
-
130
-
131
-
132
-
133
-
134
-
135
-
136
-
137
-
138
-
139
-
140
-
141
-
142
-
143
-
144
-
145
-
146
-
147
-
148
-
149
-
150
-
151
-
152
-
153
-
154
-
155
-
156
-
157
-
158
-
159
-
160
-
161
-
162
-
163
-
164
-
165
-
166
-
167
-
168
-
169
-
170
-
171
-
172
-
173
-
174
-
175
-
176
-
177
-
178
-
179
-
180
-
181
-
182
-
183
-
184
-
185
-
186
-
187
-
188
-
189
-
190
-
191
-
192
-
193
-
194
-
195
-
196
-
197
-
198
-
199
-
200
-
201
-
202
-
203
-
204
-
205
-
206
-
207
-
208
-
209
-
210
-
211
-
212
-
213
-
214
-
215
-
216
-
217
-
218
-
219
-
220
-
221
-
222
-
223
-
224
-
225
-
226
-
227
-
228
-
229
-
230
-
231
-
232
-
233
-
234
 |
 |
section
01
Operating and
financial review
87
Annual Report and Accounts 2004
Operating and financial review
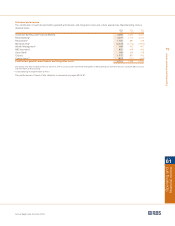
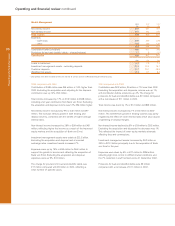
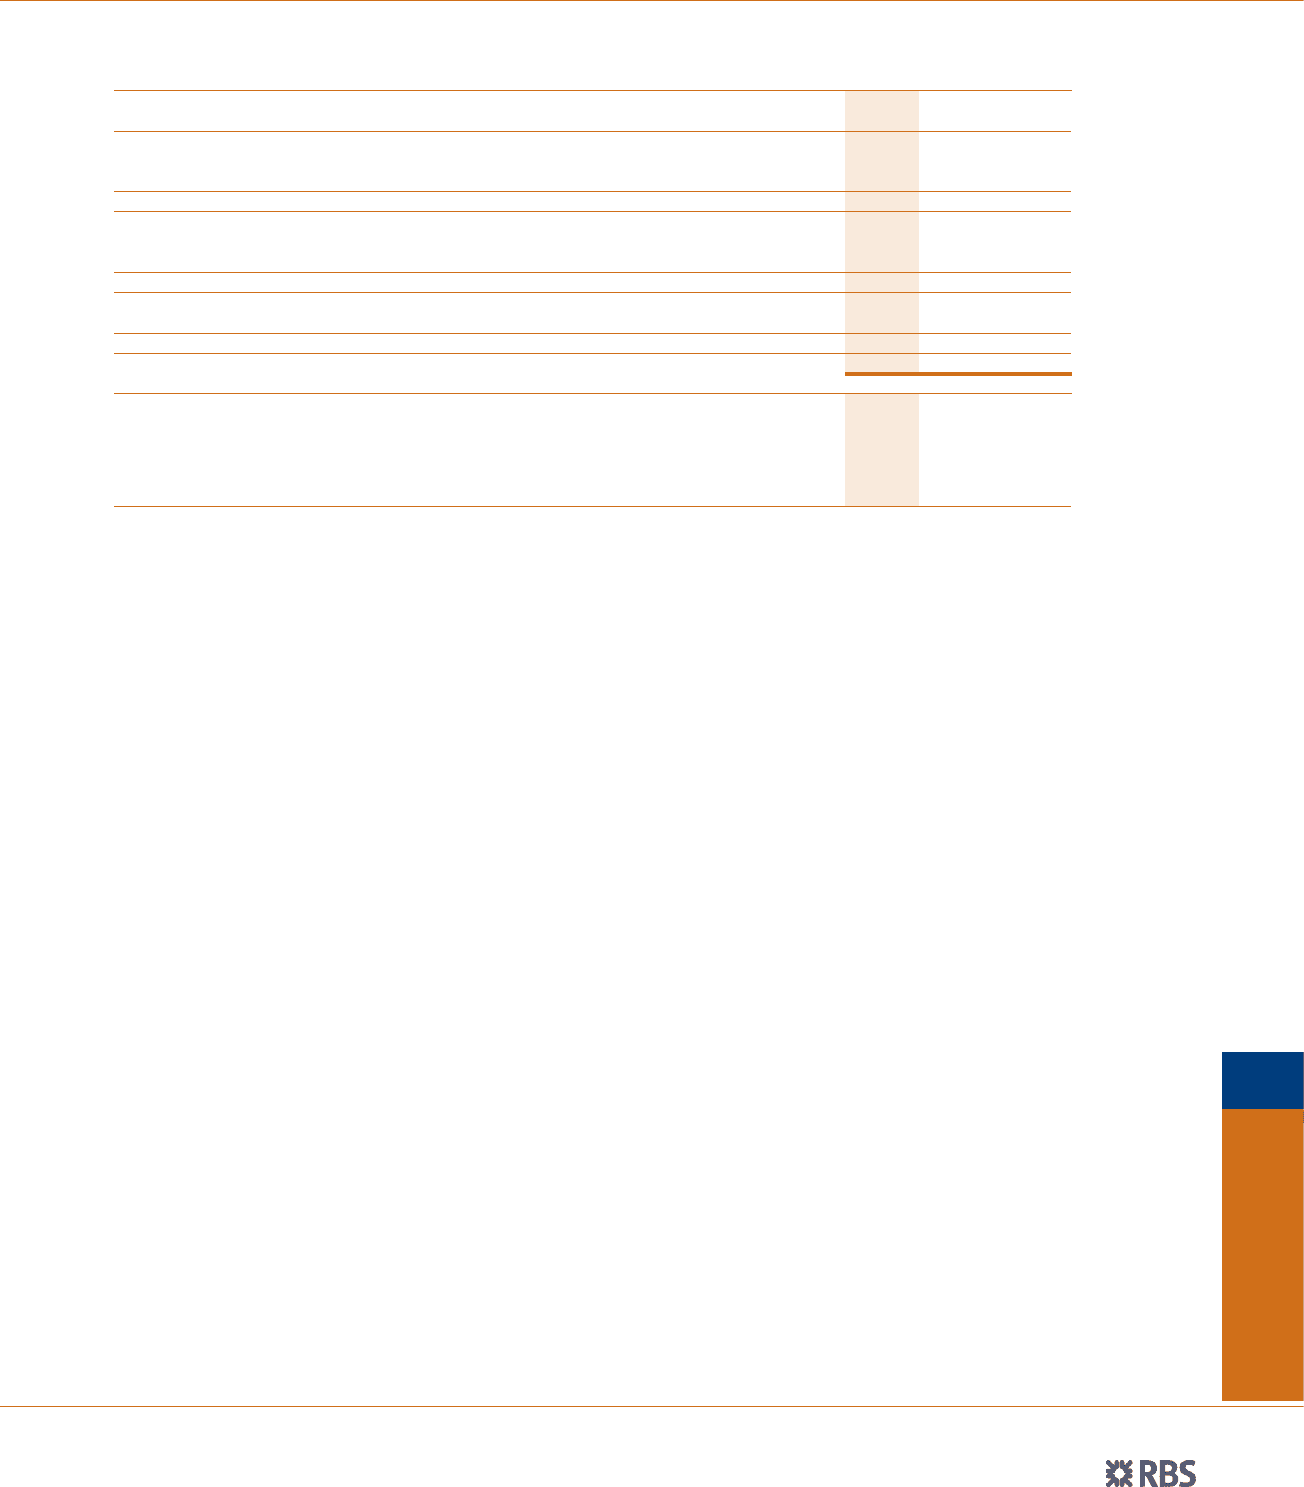
RBS Insurance
2004 2003* 2002*
£m £m £m
Earned premiums 5,357 3,627 2,442
Reinsurers’ share (413) (504) (489)
Insurance premium income 4,944 3,123 1,953
Net fees and commissions (488) (161) 6
Other income 478 283 180
Total income 4,934 3,245 2,139
Expenses
– staff costs 293 222 166
– other 299 219 167
592 441 333
Gross claims 3,724 2,644 1,693
Reinsurers’ share (244) (449) (343)
Net claims 3,480 2,195 1,350
Contribution 862 609 456
In-force policies (000’s)
– Motor: UK 8,338 8,086 4,668
– Motor: Continental Europe 1,639 1,425 1,165
– Other (including home, rescue, pet): UK 10,919 10,518 6,697
Gross insurance reserves – total (£m) 7,394 6,582 3,002
* prior periods have been restated to reflect the transfer in 2004 of certain activities to Manufacturing and to recognise a reclassification of income from net fees and commissions
to insurance premium income.
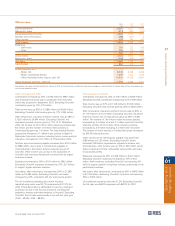
2004 compared with 2003
Contribution increased by 42% or £253 million to £862 million
and included the first full year's contribution from Churchill,
which was acquired in September 2003. Excluding Churchill,
contribution grew by 13%, £73 million.
Total income was up 52% or £1,689 million to £4,934 million.
Excluding Churchill, total income grew by 17%, £450 million.
After reinsurance, insurance premium income was up 58% or
£1,821 million to £4,944 million. Excluding Churchill, net
insurance premium income grew by 17%. At 31 December
2004, the number of UK in-force motor insurance policies was
8.3 million and the number of in-force motor policies in
Continental Europe was 1.6 million. The International Division
passed the milestone of 1 million motor policies in Spain in
December. Non-motor policies, including home, rescue and pet
insurance, increased to 10.9 million at 31 December 2004.
Net fees and commissions payable increased from £161 million
to £488 million, due mainly to commissions payable to
intermediaries in the broker division acquired as part of
Churchill. Other income was up due to the acquisition of
Churchill and increased investment income driven by higher
business volumes.
Expenses increased by 34% or £151 million to £592 million.
Excluding Churchill, expenses increased by 10%, £37 million,
to support higher business volumes.
Net claims, after reinsurance, increased by 59% or £1,285
million to £3,480 million. Excluding Churchill, net claims
increased by 20%, consistent with mix and volume growth.
The UK combined operating ratio, which includes
manufacturing costs, was 93.7% compared with 91.2% for
2003. This deterioration is attributable in part to a change in
business mix due to the full year impact of commissions
payable to brokers and intermediaries in Churchill. Excluding
Churchill, the UK ratio was broadly in line with the prior year
(2004 – 89.9%; 2003 – 88.6%).
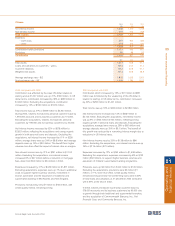
2003 compared with 2002
Contribution increased by 34% or £153 million to £609 million.
Excluding Churchill, contribution increased by 22% or £99 million.
Total income was up 52% or £1,106 million to £3,245 million.
Excluding Churchill, total income grew by 25% or £525 million.
After reinsurance, insurance premium income was up 60% or
£1,170 million to £3,123 million. Excluding Churchill, insurance
premium income (net of reinsurance) grew by 25% or £490
million. The number of UK in-force motor insurance policies
increased by 3.4 million of which 3.1 million was from Churchill,
while the number of UK in-force home insurance policies
increased by 3.6 million including 3.4 million from Churchill.
The number of motor policies in Continental Europe increased
by 260,000 during the year.
Other income net of commissions payable was down from
£186 million to £122 million. Excluding Churchill, which
included £148 million commissions payable to brokers and
intermediaries, other income was up 19% or £35 million due to
higher investment income, embedded value profits and share
of associates profits.
Expenses increased by 32% or £108 million to £441 million.
Excluding Churchill, expenses increased by 10% or £33
million. Staff numbers, excluding Churchill, increased by 4%
(400) to support growth in business volumes, particularly in the
partnership business.
Net claims, after reinsurance, increased by 63% or £845 million
to £2,195 million. Excluding Churchill, net claims increased by
29% or £393 million.
UK combined operating ratio was 91.2%. Excluding Churchill,
the UK ratio was 88.6% compared with 88.2% for 2002.