RBS 2004 Annual Report Download - page 193
Download and view the complete annual report
Please find page 193 of the 2004 RBS annual report below. You can navigate through the pages in the report by either clicking on the pages listed below, or by using the keyword search tool below to find specific information within the annual report.-
 1
1 -
2
-
3
-
4
-
5
-
6
-
7
-
8
-
9
-
10
-
11
-
12
-
13
-
14
-
15
-
16
-
17
-
18
-
19
-
20
-
21
-
22
-
23
-
24
-
25
-
26
-
27
-
28
-
29
-
30
-
31
-
32
-
33
-
34
-
35
-
36
-
37
-
38
-
39
-
40
-
41
-
42
-
43
-
44
-
45
-
46
-
47
-
48
-
49
-
50
-
51
-
52
-
53
-
54
-
55
-
56
-
57
-
58
-
59
-
60
-
61
-
62
-
63
-
64
-
65
-
66
-
67
-
68
-
69
-
70
-
71
-
72
-
73
-
74
-
75
-
76
-
77
-
78
-
79
-
80
-
81
-
82
-
83
-
84
-
85
-
86
-
87
-
88
-
89
-
90
-
91
-
92
-
93
-
94
-
95
-
96
-
97
-
98
-
99
-
100
-
101
-
102
-
103
-
104
-
105
-
106
-
107
-
108
-
109
-
110
-
111
-
112
-
113
-
114
-
115
-
116
-
117
-
118
-
119
-
120
-
121
-
122
-
123
-
124
-
125
-
126
-
127
-
128
-
129
-
130
-
131
-
132
-
133
-
134
-
135
-
136
-
137
-
138
-
139
-
140
-
141
-
142
-
143
-
144
-
145
-
146
-
147
-
148
-
149
-
150
-
151
-
152
-
153
-
154
-
155
-
156
-
157
-
158
-
159
-
160
-
161
-
162
-
163
-
164
-
165
-
166
-
167
-
168
-
169
-
170
-
171
-
172
-
173
-
174
-
175
-
176
-
177
-
178
-
179
-
180
-
181
-
182
-
 183
183 -
 184
184 -
 185
185 -
 186
186 -
 187
187 -
 188
188 -
 189
189 -
 190
190 -
 191
191 -
 192
192 -
 193
193 -
 194
194 -
 195
195 -
 196
196 -
 197
197 -
 198
198 -
 199
199 -
 200
200 -
 201
201 -
 202
202 -
 203
203 -
204
-
205
-
206
-
207
-
208
-
209
-
210
-
211
-
212
-
213
-
214
-
215
-
216
-
217
-
218
-
219
-
220
-
221
-
222
-
223
-
224
-
225
-
226
-
227
-
228
-
229
-
230
-
231
-
232
-
233
-
234
 |
 |
section
03
191
Annual Report and Accounts 2004
Notes on the accounts
Financial
statements
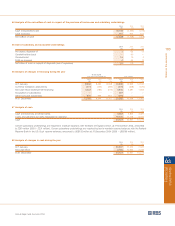
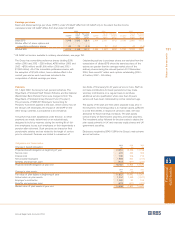
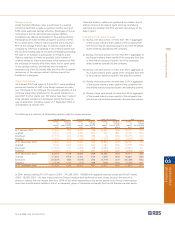
Earnings per share
Basic and diluted earnings per share (“EPS”) under US GAAP differ from UK GAAP only to the extent that the income
calculated under US GAAP differs from that under UK GAAP.
2004 2003 2002
No. of Per share No. of Per share No. of Per share
Income* shares amount Income* shares amount Income* shares amount
£m million pence £m million pence £m million pence
Basic EPS 3,948 3,085 128.0 2,564 2,931 87.5 3,108 2,881 107.9
Dilutive effect of share options and
convertible preference shares 66 73 (0.9) — 22 (0.7) — 43 (1.6)
Diluted EPS 4,014 3,158 127.1 2,564 2,953 86.8 3,108 2,924 106.3
* US GAAP net income available to ordinary shareholders, see page 190.
Pensions
On 1 April 2002, the Group’s main pension schemes, The
Royal Bank of Scotland Staff Pension Scheme and the National
Westminster Bank Pension Fund, were merged to form The
Royal Bank of Scotland Group Pension Fund (“the plan”).
The provisions of SFAS 87 ‘Employers’ Accounting for
Pensions’ have been applied to the plan, which covers most of
the Group’s UK employees; the impact of US GAAP on the
other Group schemes is considered to be immaterial.
A trust fund has been established under the plan, to which
payments are made, determined on an actuarial basis,
designed to build up reserves during the working life of full-
time employees to pay such employees or their dependants a
pension after retirement. Such pensions are based on final
pensionable salaries and are related to the length of service
prior to retirement. Pensions are limited to a maximum of
two-thirds of final salary for 40 years service or more. Staff do
not make contributions for basic pensions but may make
voluntary contributions on a regular basis to purchase
additional service qualification where less than 40 years
service will have been completed by normal retirement age.
The assets of the plan are held under separate trusts and, in
the long-term, the funding policy is to maintain assets sufficient
to cover the benefits in respect of service to date, with due
allowance for future earnings increases. The plan assets
consist mainly of fixed-income securities and listed securities.
The investment policy followed for the plan seeks to deploy the
plan assets primarily in UK and overseas equity shares and UK
government securities.
Disclosures required by SFAS 132R for the Group’s main scheme
are set out below.
The Group has convertible preference shares totalling £200
million (2003 and 2002 – £200 million), 750 million (2003 and
2002 – 750 million) and $1,900 million (2003 and 2002 –
$1,900 million). All of the convertible preference shares, with
the exception of $1,500 million, have a dilutive effect in the
current year and as such have been included in the
computation of diluted earnings per share.
Outstanding options to purchase shares are excluded from the
computation of diluted EPS where the exercise prices of the
options are greater than the average market price of the
ordinary shares during the relevant period. At 31 December
2004, there were 8.7 million such options outstanding (2003 –
5.2 million; 2002 – 3.8 million).
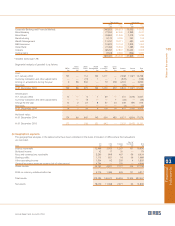
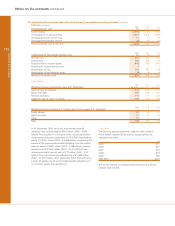
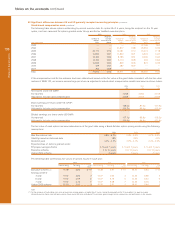
Obligations and funded status
2004 2003 2002
Change in benefit obligation: £m £m £m
Projected benefit obligation at beginning of year 13,963 12,526 12,198
Service cost 420 340 303
Interest cost 768 706 715
Net actuarial loss/(gain) 1,568 902 (217)
Benefits and expenses paid (527) (511) (473)
Projected benefit obligation at year end 16,192 13,963 12,526
2004 2003 2002
Change in plan assets: £m £m £m
Fair value of plan assets at beginning of year 11,822 10,682 12,567
Actual return on plan assets 1,234 1,559 (1,521)
Employer’s contribution 1,069 92 109
Benefits and expenses paid (527) (511) (473)
Market value of plan assets at year end 13,598 11,822 10,682