RBS 2004 Annual Report Download - page 97
Download and view the complete annual report
Please find page 97 of the 2004 RBS annual report below. You can navigate through the pages in the report by either clicking on the pages listed below, or by using the keyword search tool below to find specific information within the annual report.-
 1
1 -
2
-
3
-
4
-
5
-
6
-
7
-
8
-
9
-
10
-
11
-
12
-
13
-
14
-
15
-
16
-
17
-
18
-
19
-
20
-
21
-
22
-
23
-
24
-
25
-
26
-
27
-
28
-
29
-
30
-
31
-
32
-
33
-
34
-
35
-
36
-
37
-
38
-
39
-
40
-
41
-
42
-
43
-
44
-
45
-
46
-
47
-
48
-
49
-
50
-
51
-
52
-
53
-
54
-
55
-
56
-
57
-
58
-
59
-
60
-
61
-
62
-
63
-
64
-
65
-
66
-
67
-
68
-
69
-
70
-
71
-
72
-
73
-
74
-
75
-
76
-
77
-
78
-
79
-
80
-
81
-
82
-
83
-
84
-
85
-
86
-
 87
87 -
 88
88 -
 89
89 -
 90
90 -
 91
91 -
 92
92 -
 93
93 -
 94
94 -
 95
95 -
 96
96 -
 97
97 -
 98
98 -
 99
99 -
 100
100 -
 101
101 -
 102
102 -
 103
103 -
 104
104 -
 105
105 -
 106
106 -
 107
107 -
108
-
109
-
110
-
111
-
112
-
113
-
114
-
115
-
116
-
117
-
118
-
119
-
120
-
121
-
122
-
123
-
124
-
125
-
126
-
127
-
128
-
129
-
130
-
131
-
132
-
133
-
134
-
135
-
136
-
137
-
138
-
139
-
140
-
141
-
142
-
143
-
144
-
145
-
146
-
147
-
148
-
149
-
150
-
151
-
152
-
153
-
154
-
155
-
156
-
157
-
158
-
159
-
160
-
161
-
162
-
163
-
164
-
165
-
166
-
167
-
168
-
169
-
170
-
171
-
172
-
173
-
174
-
175
-
176
-
177
-
178
-
179
-
180
-
181
-
182
-
183
-
184
-
185
-
186
-
187
-
188
-
189
-
190
-
191
-
192
-
193
-
194
-
195
-
196
-
197
-
198
-
199
-
200
-
201
-
202
-
203
-
204
-
205
-
206
-
207
-
208
-
209
-
210
-
211
-
212
-
213
-
214
-
215
-
216
-
217
-
218
-
219
-
220
-
221
-
222
-
223
-
224
-
225
-
226
-
227
-
228
-
229
-
230
-
231
-
232
-
233
-
234
 |
 |
section
01
Operating and
financial review
95
Annual Report and Accounts 2004
Operating and financial review
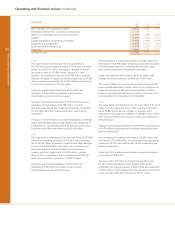
UK GAAP compared with US GAAP
The Group’s financial statements are prepared in accordance
with UK GAAP, which differs in certain material respects from
US GAAP as described on pages 187 to 199.
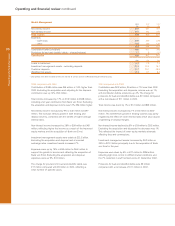
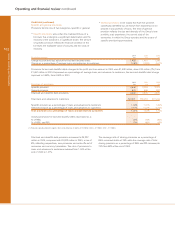
The net income available for ordinary shareholders under US
GAAP was £3,948 million, £308 million lower than profit
attributable to ordinary shareholders under UK GAAP of
£4,256 million. The principle reasons for the decrease are:
•A reduction of £437 million relating to derivatives and
hedging. Under US GAAP, non-derivative financial
instruments cannot be designated as hedges of the foreign
exchange exposure of available-for-sale securities; such
hedging is permitted under UK GAAP. Under US GAAP, the
Group has not designated any of its non-trading derivatives
as hedges and these are recorded at fair value. Furthermore,
US GAAP requires certain embedded derivatives to be
accounted for separately from the host instrument.
•Higher pension costs under US GAAP compared with UK
GAAP principally reflecting deferral of actuarial gains and
losses over the average remaining service lives of current
employees under US GAAP. Actuarial gains and losses are
recognised in full in the statement of total recognised gains
and losses for the period under UK GAAP.
•A net decrease in net income of £261 million relating to
capitalisation and amortisation of software development
costs that meet certain criteria under US GAAP. Such costs
are generally charged to the profit and loss account under
UK GAAP.
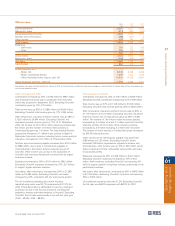
The above decreases are partially offset by an increase of
£780 million in net income under US GAAP relating to intangible
assets. Goodwilll amortisation is charged to the profit and loss
account under UK GAAP whereas under US GAAP only
intangible assets with finite lives are amortised. Goodwill is not
amortised but instead is reviewed annually for impairment.
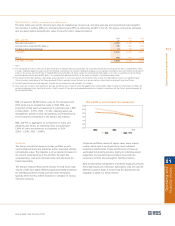
US GAAP shareholders’ equity at £36,191 million is £4,326
million higher than shareholders’ equity under UK GAAP,
principally due to the reinstatement of goodwill amortised
under UK GAAP and the reversal of the final dividend.
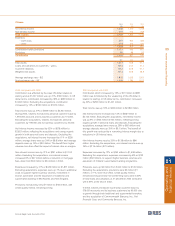
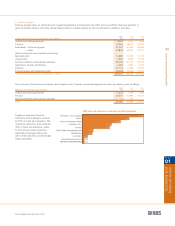
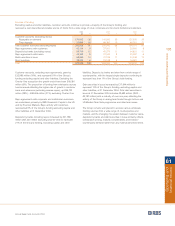
Capital resources
The following table analyses the Group’s regulatory capital resources at the period end:
2004 2003 2002 2001 2000
£m £m £m £m £m
Capital base
Tier 1 capital 22,694 19,399 17,155 15,052 12,071
Tier 2 capital 20,229 16,439 13,271 11,734 10,082
Tier 3 capital –– — — 172 167
42,923 35,838 30,426 26,958 22,320
Less: investments in insurance subsidiaries, associated
undertakings and other supervisory deductions (5,165) (4,618) (3,146) (2,698) (2,228)
Total capital 37,758 31,220 27,280 24,260 20,092
Weighted risk assets
Banking book:
On-balance sheet 261,800 214,400 193,800 176,000 146,600
Off-balance sheet 44,900 36,400 28,700 22,000 16,200
Trading book 17,100 12,900 11,500 12,500 12,400
323,800 263,700 234,000 210,500 175,200
Risk asset ratios %%%%%
Tier 1 7.0 7.4 7.3 7.1 6.9
Total 11.7 11.8 11.7 11.5 11.5
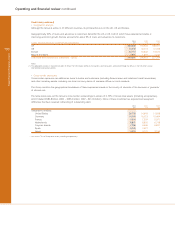
It is the Group’s policy to maintain a strong capital base, to
expand it as appropriate and to utilise it efficiently throughout
its activities to optimise the return to shareholders while
maintaining a prudent relationship between the capital base
and the underlying risks of the business. In carrying out this
policy, the Group has regard to the supervisory requirements
of the Financial Services Authority (“FSA”). The FSA uses Risk
Asset Ratio (“RAR”) as a measure of capital adequacy in the
UK banking sector, comparing a bank’s capital resources with
its weighted risk assets (the assets and off-balance sheet
exposures are ‘weighted’ to reflect the inherent credit and
other risks); by international agreement, the RAR should be
not less than 8% with a tier 1 component of not less than 4%.
At 31 December 2004, the Group’s total RAR was 11.7%
(2003 – 11.8%) and the tier 1 RAR was 7.0% (2003 – 7.4%).