RBS 2004 Annual Report Download - page 177
Download and view the complete annual report
Please find page 177 of the 2004 RBS annual report below. You can navigate through the pages in the report by either clicking on the pages listed below, or by using the keyword search tool below to find specific information within the annual report.-
 1
1 -
2
-
3
-
4
-
5
-
6
-
7
-
8
-
9
-
10
-
11
-
12
-
13
-
14
-
15
-
16
-
17
-
18
-
19
-
20
-
21
-
22
-
23
-
24
-
25
-
26
-
27
-
28
-
29
-
30
-
31
-
32
-
33
-
34
-
35
-
36
-
37
-
38
-
39
-
40
-
41
-
42
-
43
-
44
-
45
-
46
-
47
-
48
-
49
-
50
-
51
-
52
-
53
-
54
-
55
-
56
-
57
-
58
-
59
-
60
-
61
-
62
-
63
-
64
-
65
-
66
-
67
-
68
-
69
-
70
-
71
-
72
-
73
-
74
-
75
-
76
-
77
-
78
-
79
-
80
-
81
-
82
-
83
-
84
-
85
-
86
-
87
-
88
-
89
-
90
-
91
-
92
-
93
-
94
-
95
-
96
-
97
-
98
-
99
-
100
-
101
-
102
-
103
-
104
-
105
-
106
-
107
-
108
-
109
-
110
-
111
-
112
-
113
-
114
-
115
-
116
-
117
-
118
-
119
-
120
-
121
-
122
-
123
-
124
-
125
-
126
-
127
-
128
-
129
-
130
-
131
-
132
-
133
-
134
-
135
-
136
-
137
-
138
-
139
-
140
-
141
-
142
-
143
-
144
-
145
-
146
-
147
-
148
-
149
-
150
-
151
-
152
-
153
-
154
-
155
-
156
-
157
-
158
-
159
-
160
-
161
-
162
-
163
-
164
-
165
-
166
-
 167
167 -
 168
168 -
 169
169 -
 170
170 -
 171
171 -
 172
172 -
 173
173 -
 174
174 -
 175
175 -
 176
176 -
 177
177 -
 178
178 -
 179
179 -
 180
180 -
 181
181 -
 182
182 -
 183
183 -
 184
184 -
 185
185 -
 186
186 -
 187
187 -
188
-
189
-
190
-
191
-
192
-
193
-
194
-
195
-
196
-
197
-
198
-
199
-
200
-
201
-
202
-
203
-
204
-
205
-
206
-
207
-
208
-
209
-
210
-
211
-
212
-
213
-
214
-
215
-
216
-
217
-
218
-
219
-
220
-
221
-
222
-
223
-
224
-
225
-
226
-
227
-
228
-
229
-
230
-
231
-
232
-
233
-
234
 |
 |

section
03
175
Annual Report and Accounts 2004
Notes on the accounts
Financial
statements
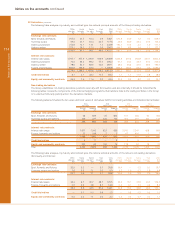
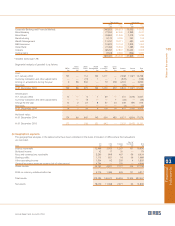
After After After
3 months 6 months 1 year Non-interest Banking Trading
Within but within but within but within After bearing book book
3 months 6 months 1 year 5 years 5 years funds total total Total
2004 £m £m £m £m £m £m £m £m £m
Assets
Loans and advances to banks 14,645 5,140 1,367 77 482 643 22,354 35,906 58,260
Loans and advances to customers 189,366 16,202 11,379 35,370 28,612 2,304 283,233 62,236 345,469
Treasury bills and debt securities 11,912 4,088 3,656 6,133 13,548 337 39,674 57,647 97,321
Other assets —————57,508 57,508 24,909 82,417
Total assets 215,923 25,430 16,402 41,580 42,642 60,792 402,769 180,698 583,467
Liabilities
Deposits by banks 54,679 2,282 907 119 477 935 59,399 39,682 99,081
Customer accounts 192,543 5,589 6,948 7,043 461 31,345 243,929 41,133 285,062
Debt securities in issue 41,805 5,505 4,418 4,087 1,385 — 57,200 1,760 58,960
Subordinated liabilities 4,401 1,020 302 2,151 12,438 — 20,312 54 20,366
Other liabilities 4 5 8 49 126 34,948 35,140 52,993 88,133
Shareholders’ funds —————30,715 30,715 1,150 31,865
Internal funding of trading book (42,516) (313) (1,088) (9) — — (43,926) 43,926 ––
Total liabilities 250,916 14,088 11,495 13,440 14,887 97,943 402,769 180,698 583,467
Off-balance sheet items (2,126) (6,906) (1,160) 1,560 8,632 —
Interest rate sensitivity gap (37,119) 4,436 3,747 29,700 36,387 (37,151)
Cumulative interest rate sensitivity gap (37,119) (32,683) (28,936) 764 37,151
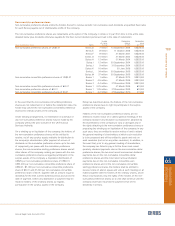
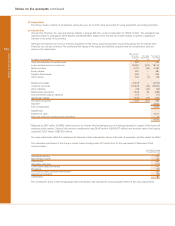
The Group’s objectives and policies in managing the risks that
arise in connection with the use of financial instruments are set
out in the Operating and financial review under ‘Market risk’,
‘Currency risk’ and ‘Equity risk’.
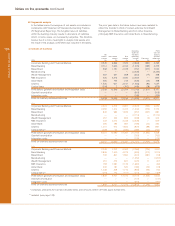
Interest rate sensitivity gap
The tables below summarise the Group’s interest rate
sensitivity gap for its non-trading book at 31 December 2004
and 31 December 2003. The tables show the contractual re-
pricing for each category of asset, liability and for off-balance
sheet items. A liability (or negative) gap position exists when
liabilities reprice more quickly or in greater proportion than
assets during a given period and tends to benefit net interest
income in a declining interest rate environment. An asset (or
positive) gap position exists when assets reprice more quickly
or in greater proportion than liabilities during a given period
and tends to benefit net interest income in a rising interest rate
environment. Contractual repricing terms do not reflect the
potential impact of early repayment or withdrawal. Positions
may not be reflective of those in subsequent periods. Major
changes in positions can be made promptly as market outlooks
change. In addition, significant variations in interest rate sensitivity
may exist within the re-pricing periods presented and among
the currencies in which the Group has interest rate positions.
40 Financial instruments