RBS 2004 Annual Report Download - page 78
Download and view the complete annual report
Please find page 78 of the 2004 RBS annual report below. You can navigate through the pages in the report by either clicking on the pages listed below, or by using the keyword search tool below to find specific information within the annual report.-
 1
1 -
2
-
3
-
4
-
5
-
6
-
7
-
8
-
9
-
10
-
11
-
12
-
13
-
14
-
15
-
16
-
17
-
18
-
19
-
20
-
21
-
22
-
23
-
24
-
25
-
26
-
27
-
28
-
29
-
30
-
31
-
32
-
33
-
34
-
35
-
36
-
37
-
38
-
39
-
40
-
41
-
42
-
43
-
44
-
45
-
46
-
47
-
48
-
49
-
50
-
51
-
52
-
53
-
54
-
55
-
56
-
57
-
58
-
59
-
60
-
61
-
62
-
63
-
64
-
65
-
66
-
67
-
 68
68 -
 69
69 -
 70
70 -
 71
71 -
 72
72 -
 73
73 -
 74
74 -
 75
75 -
 76
76 -
 77
77 -
 78
78 -
 79
79 -
 80
80 -
 81
81 -
 82
82 -
 83
83 -
 84
84 -
 85
85 -
 86
86 -
 87
87 -
 88
88 -
89
-
90
-
91
-
92
-
93
-
94
-
95
-
96
-
97
-
98
-
99
-
100
-
101
-
102
-
103
-
104
-
105
-
106
-
107
-
108
-
109
-
110
-
111
-
112
-
113
-
114
-
115
-
116
-
117
-
118
-
119
-
120
-
121
-
122
-
123
-
124
-
125
-
126
-
127
-
128
-
129
-
130
-
131
-
132
-
133
-
134
-
135
-
136
-
137
-
138
-
139
-
140
-
141
-
142
-
143
-
144
-
145
-
146
-
147
-
148
-
149
-
150
-
151
-
152
-
153
-
154
-
155
-
156
-
157
-
158
-
159
-
160
-
161
-
162
-
163
-
164
-
165
-
166
-
167
-
168
-
169
-
170
-
171
-
172
-
173
-
174
-
175
-
176
-
177
-
178
-
179
-
180
-
181
-
182
-
183
-
184
-
185
-
186
-
187
-
188
-
189
-
190
-
191
-
192
-
193
-
194
-
195
-
196
-
197
-
198
-
199
-
200
-
201
-
202
-
203
-
204
-
205
-
206
-
207
-
208
-
209
-
210
-
211
-
212
-
213
-
214
-
215
-
216
-
217
-
218
-
219
-
220
-
221
-
222
-
223
-
224
-
225
-
226
-
227
-
228
-
229
-
230
-
231
-
232
-
233
-
234
 |
 |

76
Operating and financial review
Operating and financial review continued
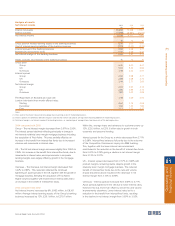
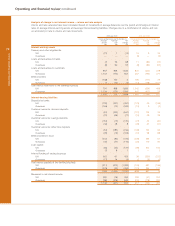
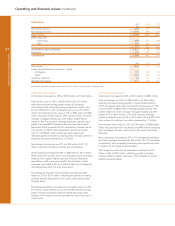
Operating expenses (excluding goodwill amortisation and integration costs)
2004 2003* 2002*
£m £m £m
Administrative expenses:
Staff costs 5,231 4,528 4,054
Premises and equipment 1,150 1,042 879
Other administrative 2,176 2,035 1,955
Total administrative expenses 8,557 7,605 6,888
Depreciation of tangible fixed assets 1,105 919 893
9,662 8,524 7,781
* restated (see page 139)
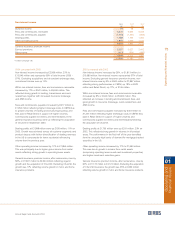
2004 compared with 2003
Operating expenses, excluding goodwill amortisation and
integration costs, rose by 13% to £9,662 million to support the
strong growth in business volumes. Excluding acquisitions and
at constant exchange rates, operating expenses were up by
9%, £739 million.
Staff costs were up £703 million, 16% to £5,231 million
reflecting acquisitions, business growth and higher pension
costs following the implementation of FRS 17. The number of
staff increased by 15,700, 13% to 136,600. Of the increase
10,500 was due to acquisitions.
Premises and equipment expenses increased by £108 million,
10% to £1,150 million reflecting investment to upgrade the
property portfolio in major UK centres to support the core
business.
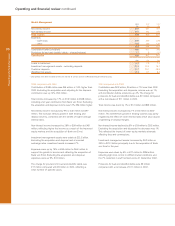
The increase in other administrative expenses reflected business
volume growth and continued expenditure in support of Group
wide projects.
The Group's ratio of operating expenses (excluding goodwill
amortisation and integration costs and after netting operating
lease depreciation against rental income) to total income
improved further to 40.8% from 42.6%.
2003 compared with 2002
Operating expenses excluding goodwill amortisation and
integration costs rose by 10% or £743 million to £8,524 million.
This increased expenditure was in support of strong organic
growth and customer service improvements. Excluding
acquisitions, operating expenses were up 7%, £544 million in
support of higher business volumes and 13% income growth.
Staff costs were up £474 million, 12% to £4,528 million
reflecting acquisitions and business growth. The number of
staff increased by 9,100, 8% to 120,900. Acquisitions in the
year added 9,700 staff of which 8,500 related to Churchill.
Premises and equipment expenses increased by £163 million,
19% to £1,042 million reflecting the continuing upgrade of the
property portfolio in major UK centres to support the core
business.
The increase in other administrative expenses reflected higher
business volumes and included expenditure in support of
Group wide projects.
Continued income growth coupled with a rigorous approach to
cost management further improved the Group’s cost:income
ratio, to 42.6% from 44.2%. Excluding the effect of acquisitions
the cost:income ratio improved to 43.9%.