RBS 2004 Annual Report Download - page 80
Download and view the complete annual report
Please find page 80 of the 2004 RBS annual report below. You can navigate through the pages in the report by either clicking on the pages listed below, or by using the keyword search tool below to find specific information within the annual report.-
 1
1 -
2
-
3
-
4
-
5
-
6
-
7
-
8
-
9
-
10
-
11
-
12
-
13
-
14
-
15
-
16
-
17
-
18
-
19
-
20
-
21
-
22
-
23
-
24
-
25
-
26
-
27
-
28
-
29
-
30
-
31
-
32
-
33
-
34
-
35
-
36
-
37
-
38
-
39
-
40
-
41
-
42
-
43
-
44
-
45
-
46
-
47
-
48
-
49
-
50
-
51
-
52
-
53
-
54
-
55
-
56
-
57
-
58
-
59
-
60
-
61
-
62
-
63
-
64
-
65
-
66
-
67
-
68
-
69
-
 70
70 -
 71
71 -
 72
72 -
 73
73 -
 74
74 -
 75
75 -
 76
76 -
 77
77 -
 78
78 -
 79
79 -
 80
80 -
 81
81 -
 82
82 -
 83
83 -
 84
84 -
 85
85 -
 86
86 -
 87
87 -
 88
88 -
 89
89 -
 90
90 -
91
-
92
-
93
-
94
-
95
-
96
-
97
-
98
-
99
-
100
-
101
-
102
-
103
-
104
-
105
-
106
-
107
-
108
-
109
-
110
-
111
-
112
-
113
-
114
-
115
-
116
-
117
-
118
-
119
-
120
-
121
-
122
-
123
-
124
-
125
-
126
-
127
-
128
-
129
-
130
-
131
-
132
-
133
-
134
-
135
-
136
-
137
-
138
-
139
-
140
-
141
-
142
-
143
-
144
-
145
-
146
-
147
-
148
-
149
-
150
-
151
-
152
-
153
-
154
-
155
-
156
-
157
-
158
-
159
-
160
-
161
-
162
-
163
-
164
-
165
-
166
-
167
-
168
-
169
-
170
-
171
-
172
-
173
-
174
-
175
-
176
-
177
-
178
-
179
-
180
-
181
-
182
-
183
-
184
-
185
-
186
-
187
-
188
-
189
-
190
-
191
-
192
-
193
-
194
-
195
-
196
-
197
-
198
-
199
-
200
-
201
-
202
-
203
-
204
-
205
-
206
-
207
-
208
-
209
-
210
-
211
-
212
-
213
-
214
-
215
-
216
-
217
-
218
-
219
-
220
-
221
-
222
-
223
-
224
-
225
-
226
-
227
-
228
-
229
-
230
-
231
-
232
-
233
-
234
 |
 |

78
Operating and financial review
Operating and financial review continued
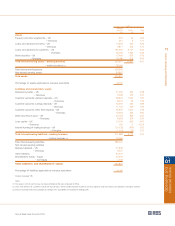
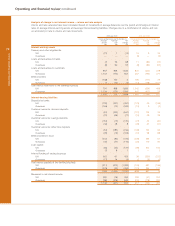
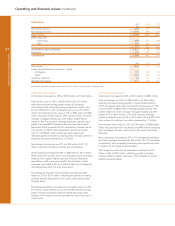
Taxation
2004 2003* 2002*
£m £m £m
Tax on profit on ordinary activities 2,155 1,888 1,582
%%%
UK corporation tax rate 30.0 30.0 30.0
Effective tax rate 31.2 31.1 32.6
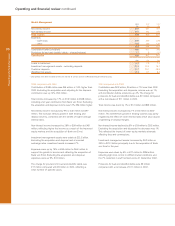
The actual tax charge differs from the expected tax charge computed by applying the standard rate of UK corporation tax
as follows:
2004 2003* 2002*
£m £m £m
Expected tax charge 2,075 1,823 1,456
Goodwill amortisation 241 200 183
Contributions to employee share schemes (32) (35) (40)
Non-deductible items 227 248 179
Non-taxable items (251) (207) (188)
Capital allowances in excess of depreciation (415) (626) (340)
Other 45 16 6
Adjustments in respect of prior periods (168) (77) (15)
Current tax charge for year 1,722 1,342 1,241
Deferred taxation:
Origination and reversal of timing differences 482 581 397
Adjustments in respect of prior periods (49) (35) (56)
Actual tax charge 2,155 1,888 1,582
* restated (see page 139)
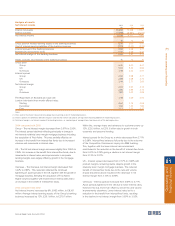
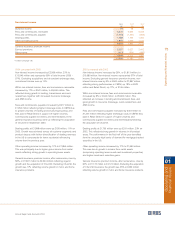
2004 compared with 2003
Gross new provisions were up 6%, £92 million to £1,658 million.
Recoveries of amounts previously written more than doubled to
£147 million. Consequently the net charge to the profit and loss
account was up £17 million, 1% to £1,511 million.
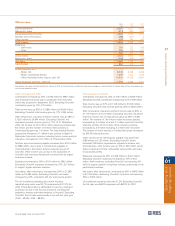
Bad debt provisions amounted to £1,428 million compared with
£1,461 million in 2003, a decrease of 2%. Amounts written off
fixed asset investments were up from £33 million in 2003 to £83
million.
Total balance sheet provisions for bad and doubtful debts
amounted to £4,228 million compared with £3,929 million at 31
December 2003. Total provision coverage (the ratio of total
balance sheet provisions to total risk elements in lending)
remained stable at 76%.
The ratio of total balance sheet provisions to total risk elements
in lending and potential problem loans increased to 73%
compared with 68% at 31 December 2003.
2003 compared with 2002
Gross new provisions were up 11%, £158 million to £1,566 million.
Recoveries of amounts previously written off were up £9 million,
14%, to £72 million. Consequently the net charge to the profit
and loss account was up £149 million, 11% to £1,494 million.
Bad debt provisions amounted to £1,461 million compared with
£1,286 million in 2002, an increase of 14%. The increased
charge was in line with the growth in lending during 2003.
Amounts written off fixed asset investments, largely in the
second half of the year, were down £26 million to £33 million
compared with £59 million in 2002.
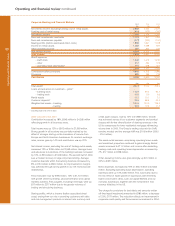
Total balance sheet provisions for bad and doubtful debts
amounted to £3,929 million compared with £3,927 million at
31 December 2002. Total provision coverage (the ratio of total
balance sheet provisions to total risk elements in lending) was
76% compared with 80% at 31 December 2002.
The ratio of total balance sheet provisions to total risk elements
in lending and potential problem loans increased to 68%
compared with 65% at 31 December 2002.
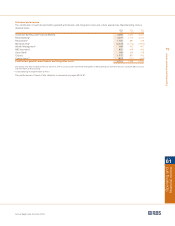
Provisions
2004 2003 2002
£m £m £m
Net new provisions 1,658 1,566 1,408
less: recoveries of amounts previously written off (147) (72) (63)
Charge to profit and loss account 1,511 1,494 1,345
Comprising:
Provisions for bad and doubtful debts 1,428 1,461 1,286
Amounts written off fixed asset investments 83 33 59
Charge to profit and loss account 1,511 1,494 1,345