RBS 2004 Annual Report Download - page 159
Download and view the complete annual report
Please find page 159 of the 2004 RBS annual report below. You can navigate through the pages in the report by either clicking on the pages listed below, or by using the keyword search tool below to find specific information within the annual report.-
 1
1 -
2
-
3
-
4
-
5
-
6
-
7
-
8
-
9
-
10
-
11
-
12
-
13
-
14
-
15
-
16
-
17
-
18
-
19
-
20
-
21
-
22
-
23
-
24
-
25
-
26
-
27
-
28
-
29
-
30
-
31
-
32
-
33
-
34
-
35
-
36
-
37
-
38
-
39
-
40
-
41
-
42
-
43
-
44
-
45
-
46
-
47
-
48
-
49
-
50
-
51
-
52
-
53
-
54
-
55
-
56
-
57
-
58
-
59
-
60
-
61
-
62
-
63
-
64
-
65
-
66
-
67
-
68
-
69
-
70
-
71
-
72
-
73
-
74
-
75
-
76
-
77
-
78
-
79
-
80
-
81
-
82
-
83
-
84
-
85
-
86
-
87
-
88
-
89
-
90
-
91
-
92
-
93
-
94
-
95
-
96
-
97
-
98
-
99
-
100
-
101
-
102
-
103
-
104
-
105
-
106
-
107
-
108
-
109
-
110
-
111
-
112
-
113
-
114
-
115
-
116
-
117
-
118
-
119
-
120
-
121
-
122
-
123
-
124
-
125
-
126
-
127
-
128
-
129
-
130
-
131
-
132
-
133
-
134
-
135
-
136
-
137
-
138
-
139
-
140
-
141
-
142
-
143
-
144
-
145
-
146
-
147
-
148
-
 149
149 -
 150
150 -
 151
151 -
 152
152 -
 153
153 -
 154
154 -
 155
155 -
 156
156 -
 157
157 -
 158
158 -
 159
159 -
 160
160 -
 161
161 -
 162
162 -
 163
163 -
 164
164 -
 165
165 -
 166
166 -
 167
167 -
 168
168 -
 169
169 -
170
-
171
-
172
-
173
-
174
-
175
-
176
-
177
-
178
-
179
-
180
-
181
-
182
-
183
-
184
-
185
-
186
-
187
-
188
-
189
-
190
-
191
-
192
-
193
-
194
-
195
-
196
-
197
-
198
-
199
-
200
-
201
-
202
-
203
-
204
-
205
-
206
-
207
-
208
-
209
-
210
-
211
-
212
-
213
-
214
-
215
-
216
-
217
-
218
-
219
-
220
-
221
-
222
-
223
-
224
-
225
-
226
-
227
-
228
-
229
-
230
-
231
-
232
-
233
-
234
 |
 |
section
03
157
Annual Report and Accounts 2004
Notes on the accounts
Financial
statements
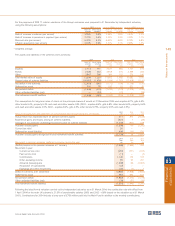
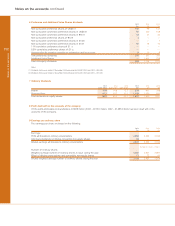
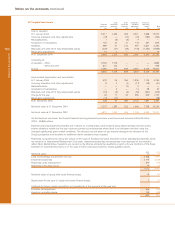
The following table categorises the Group’s investment debt securities by maturity and yield (based on weighted averages)
at 31 December 2004:
After 1 but After 5 but
Within 1 year within 5 years within 10 years After 10 years Total
Amount Yield Amount Yield Amount Yield Amount Yield Amount Yield
£m % £m % £m % £m % £m %
UK government 61 8.2 489 5.9 184 5.7 26 2.5 760 5.9
US treasury and other US government 254 1.4 326 2.2 944 2.6 11,185 3.0 12,709 3.0
Other government 442 1.7 617 3.9 314 3.8 4 5.7 1,377 3.2
Securities issued by the states of the US — — 18 4.9 16 4.1 18 3.4 52 4.1
Other public sector bodies 99 1.0 8 4.6 202 2.0 –– — 309 1.7
Corporate debt securities 750 3.5 982 3.8 227 4.0 224 4.9 2,183 3.8
Mortgage-backed securities 12 2.5 211 7.0 1,168 3.4 3,473 4.1 4,864 4.1
Bank and building society 8,158 5.2 1,089 3.4 44 5.0 28 5.3 9,319 5.0
Other 1,768 4.0 1,421 5.4 221 2.5 80 2.1 3,490 4.5
Total book value 11,544 4.6 5,161 4.4 3,320 3.2 15,038 3.3 35,063 3.9
Total fair value 11,297 5,201 3,288 15,091 34,877
Gross gains of £101 million (2003 – £158 million) and gross losses of £30 million (2003 – £47 million) were realised on the sale and
redemption of investment debt securities.
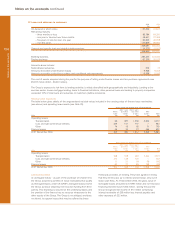
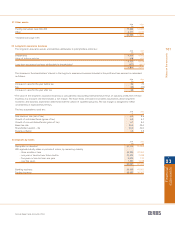
16 Equity shares
Gross Gross Gross Gross
2004 unrecognised unrecognised 2004 2003 unrecognised unrecognised 2003
Book value gains losses Valuation Book value gains losses Valuation
£m £m £m £m £m £m £m £m
Investment securities:
Listed 1,213 356 (78) 1,491 1,157 350 (88) 1,419
Unlisted 1,227 169 (5) 1,391 664 174 (19) 819
2,440 525 (83) 2,882 1,821 524 (107) 2,238
Other securities:
Listed 519 — — 519 465 — — 465
Unlisted 1 — — 1 14——14
2,960 525 (83) 3,402 2,300 524 (107) 2,717
Banking business 2,474 1,872
Trading business 486 428
The cost of securities carried at market value is not disclosed because it cannot be determined without unreasonable expense.
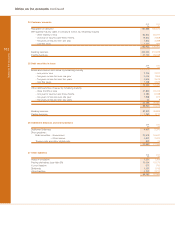
Movements in equity shares which are held as investment securities were as follows:
Cost Provisions Book value
£m £m £m
At 1 January 2004 1,940 (119) 1,821
Currency translation and other adjustments (61) 5 (56)
Additions 573 –– 573
Acquisition of subsidiaries 381 –– 381
Disposals (288) — (288)
Amounts written off (10) 10 ––
Provisions made net of write backs –– (12) (12)
Transfers 21 –– 21
At 31 December 2004 2,556 (116) 2,440
Gross gains of £96 million (2003 – £68 million) and gross losses of nil (2003 – £7 million) were realised on the sale of
investment equity shares.