RBS 2004 Annual Report Download - page 151
Download and view the complete annual report
Please find page 151 of the 2004 RBS annual report below. You can navigate through the pages in the report by either clicking on the pages listed below, or by using the keyword search tool below to find specific information within the annual report.-
 1
1 -
2
-
3
-
4
-
5
-
6
-
7
-
8
-
9
-
10
-
11
-
12
-
13
-
14
-
15
-
16
-
17
-
18
-
19
-
20
-
21
-
22
-
23
-
24
-
25
-
26
-
27
-
28
-
29
-
30
-
31
-
32
-
33
-
34
-
35
-
36
-
37
-
38
-
39
-
40
-
41
-
42
-
43
-
44
-
45
-
46
-
47
-
48
-
49
-
50
-
51
-
52
-
53
-
54
-
55
-
56
-
57
-
58
-
59
-
60
-
61
-
62
-
63
-
64
-
65
-
66
-
67
-
68
-
69
-
70
-
71
-
72
-
73
-
74
-
75
-
76
-
77
-
78
-
79
-
80
-
81
-
82
-
83
-
84
-
85
-
86
-
87
-
88
-
89
-
90
-
91
-
92
-
93
-
94
-
95
-
96
-
97
-
98
-
99
-
100
-
101
-
102
-
103
-
104
-
105
-
106
-
107
-
108
-
109
-
110
-
111
-
112
-
113
-
114
-
115
-
116
-
117
-
118
-
119
-
120
-
121
-
122
-
123
-
124
-
125
-
126
-
127
-
128
-
129
-
130
-
131
-
132
-
133
-
134
-
135
-
136
-
137
-
138
-
139
-
140
-
 141
141 -
 142
142 -
 143
143 -
 144
144 -
 145
145 -
 146
146 -
 147
147 -
 148
148 -
 149
149 -
 150
150 -
 151
151 -
 152
152 -
 153
153 -
 154
154 -
 155
155 -
 156
156 -
 157
157 -
 158
158 -
 159
159 -
 160
160 -
 161
161 -
162
-
163
-
164
-
165
-
166
-
167
-
168
-
169
-
170
-
171
-
172
-
173
-
174
-
175
-
176
-
177
-
178
-
179
-
180
-
181
-
182
-
183
-
184
-
185
-
186
-
187
-
188
-
189
-
190
-
191
-
192
-
193
-
194
-
195
-
196
-
197
-
198
-
199
-
200
-
201
-
202
-
203
-
204
-
205
-
206
-
207
-
208
-
209
-
210
-
211
-
212
-
213
-
214
-
215
-
216
-
217
-
218
-
219
-
220
-
221
-
222
-
223
-
224
-
225
-
226
-
227
-
228
-
229
-
230
-
231
-
232
-
233
-
234
 |
 |
section
03
149
Annual Report and Accounts 2004
Notes on the accounts
Financial
statements
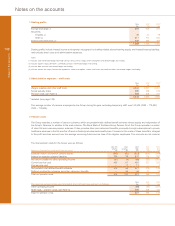
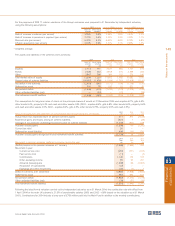
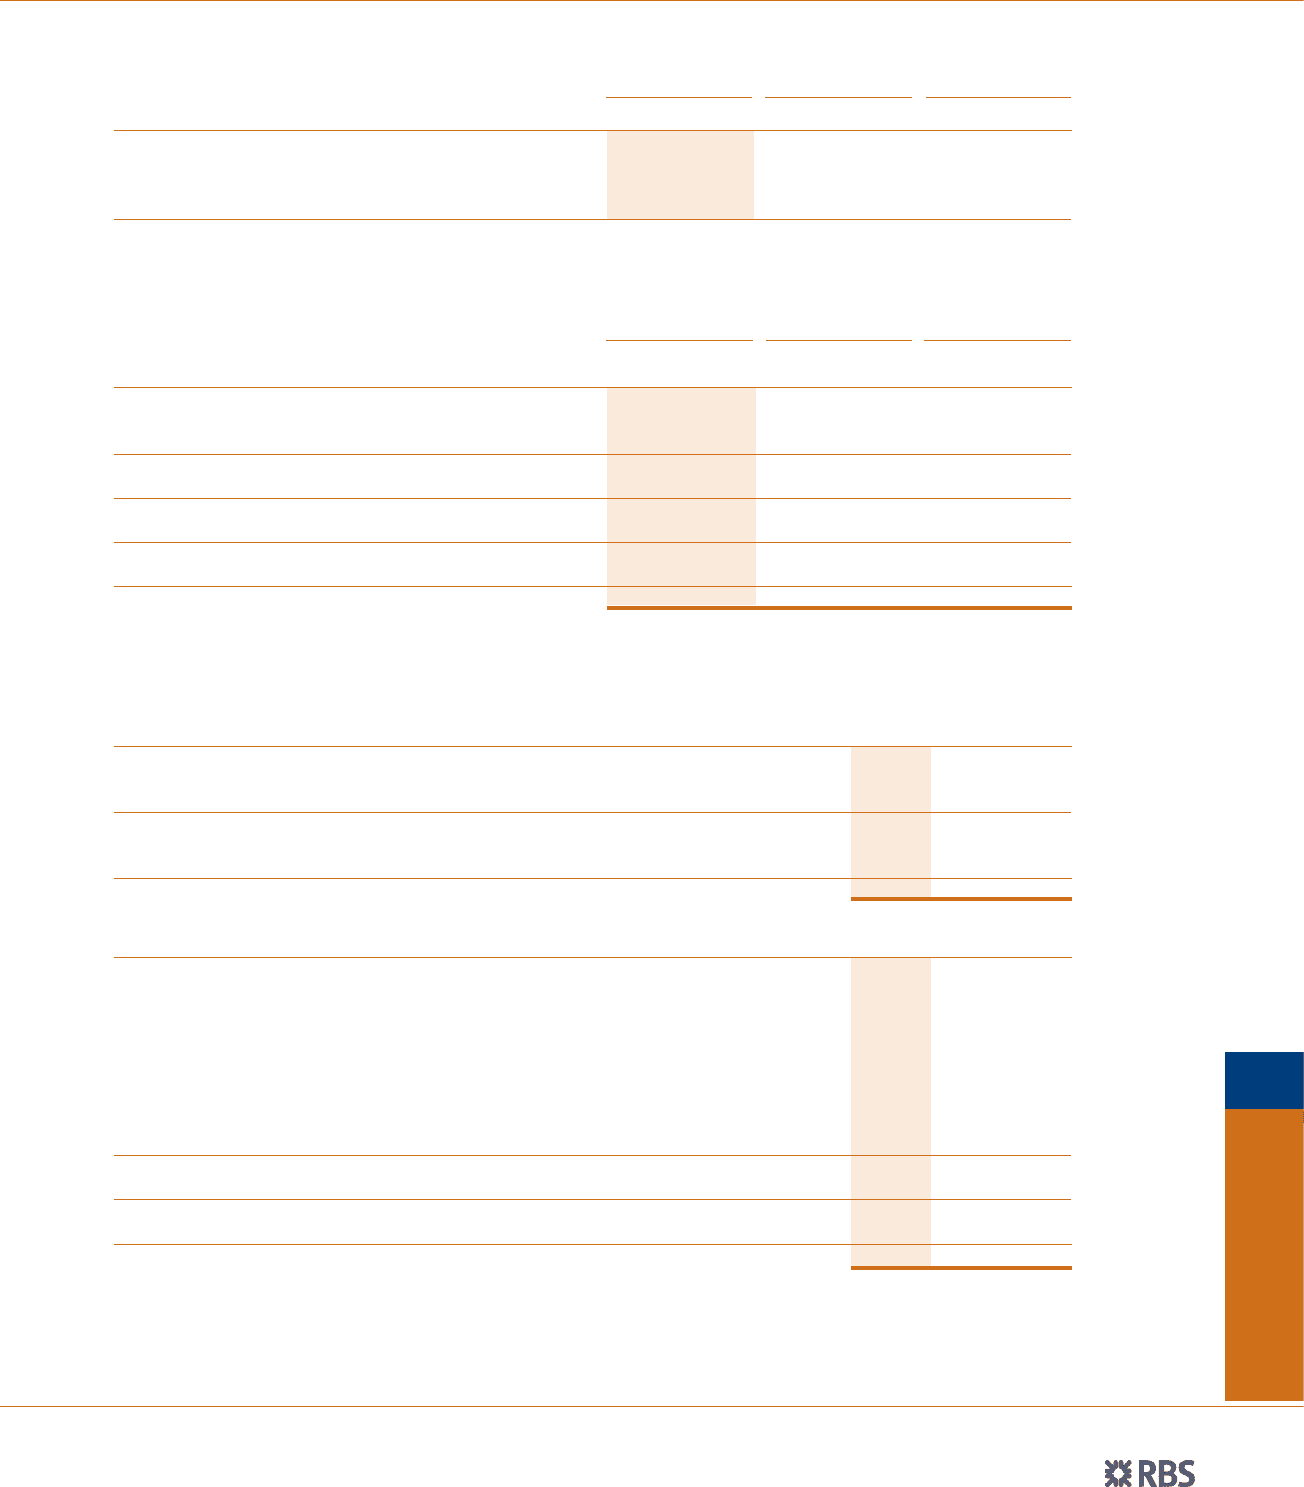
For the purposes of FRS 17, interim valuations of the Group’s schemes were prepared to 31 December by independent actuaries,
using the following assumptions:
2004 2003 2002
Main UK Other Group Main UK Other Group Main UK Other Group
scheme schemes* scheme schemes* scheme schemes*
Rate of increase in salaries (per annum) 3.95% 3.6% 3.95% 3.8% 3.50% 3.2%
Rate of increase in pensions in payment (per annum) 2.70% 2.5% 2.70% 2.3% 2.25% 1.7%
Discount rate (per annum) 5.40% 5.2% 5.60% 5.8% 5.75% 5.8%
Inflation assumption (per annum) 2.70% 2.5% 2.70% 2.1% 2.25% 1.7%
* weighted average
The assets and liabilities of the schemes were as follows:
2004 2003 2002
Main UK Other Group Main UK Other Group Main UK Other Group
scheme schemes scheme schemes schemes schemes
£m £m £m £m £m £m
Equities 7,713 777 7,621 686 7,161 610
Bonds 2,238 244 3,818 276 3,298 260
Other 3,647 208 383 103 223 140
Total market value of assets 13,598 1,229 11,822 1,065 10,682 1,010
Present value of scheme liabilities (16,051) (1,626) (13,594) (1,261) (12,418) (1,130)
Net deficit in the schemes (2,453) (397) (1,772) (196) (1,736) (120)
Deferred tax asset 905 78 532 22 521 20
Net pension deficit (1,548) (319) (1,240) (174) (1,215) (100)
Other unfunded liabilities (net) — (34) — (31) — (26)
Post-retirement benefit liabilities (1,548) (353) (1,240) (205) (1,215) (126)
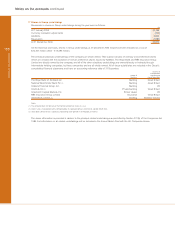
The assumptions for long-term rates of return on the principal classes of assets at 31 December 2004 were equities 8.1%, gilts 4.5%,
other bonds 5.4%, property 6.3% and cash and other assets 4.6% (2003 – equities 8.4%, gilts 4.8%, other bonds 5.6%, property 6.6%
and cash and other assets 4.9%; 2002 – equities 8.4%, gilts 4.5%, other bonds 5.75%, property 6.5% and cash 4.5%).
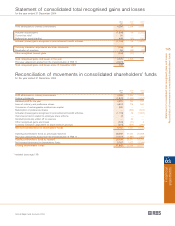
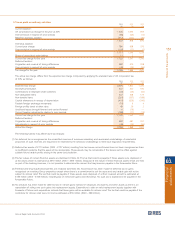
2004 2003 2002
Amount recognised in the statement of consolidated total recognised gains and losses £m £m £m
Actual return less expected return on pension scheme assets 411 872 (2,645)
Experience gains and losses arising on scheme liabilities (631) 7 (25)
Changes in assumptions underlying the present value of scheme liabilities (1,378) (810) 278
Actuarial (losses)/gains (1,598) 69 (2,392)
Current tax relief 56 ——
Deferred tax asset/(liability) 408 (33) 700
Actuarial (losses)/gains recognised in post-retirement benefit schemes (1,134) 36 (1,692)
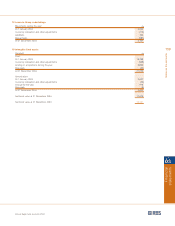
2004 2003 2002
Total Total Total
Movement in pension schemes (deficits)/ surpluses during the year £m £m £m
(Deficit)/surplus in the pension schemes at 1 January (1,968) (1,856) 492
Movement in year:
Current service cost (451) (371) (322)
Past service cost (11) — (3)
Contributions 1,145 139 167
Other operating income 85 52 201
Actuarial (losses)/gains (1,598) 69 (2,392)
Acquisition of subsidiaries (32) ——
Exchange and other movements (20) (1) 1
Deficit in schemes at 31 December (2,850) (1,968) (1,856)
Deferred tax asset 983 554 541
Net pension deficit (1,867) (1,414) (1,315)
Other unfunded liabilities (net) (34) (31) (26)
Post-retirement benefit liabilities (1,901) (1,445) (1,341)
Following the latest formal valuation carried out by independent actuaries as at 31 March 2004, the contribution rate with effect from
1 April 2004 for the main UK scheme is 21.5% of pensionable salaries (2003 and 2002 – 6.8% based on the valuation as at 31 March
2001). Contributions for 2004 include a lump sum of £750 million paid into the Main Fund in addition to the monthly contributions.