RBS 2004 Annual Report Download - page 102
Download and view the complete annual report
Please find page 102 of the 2004 RBS annual report below. You can navigate through the pages in the report by either clicking on the pages listed below, or by using the keyword search tool below to find specific information within the annual report.-
 1
1 -
2
-
3
-
4
-
5
-
6
-
7
-
8
-
9
-
10
-
11
-
12
-
13
-
14
-
15
-
16
-
17
-
18
-
19
-
20
-
21
-
22
-
23
-
24
-
25
-
26
-
27
-
28
-
29
-
30
-
31
-
32
-
33
-
34
-
35
-
36
-
37
-
38
-
39
-
40
-
41
-
42
-
43
-
44
-
45
-
46
-
47
-
48
-
49
-
50
-
51
-
52
-
53
-
54
-
55
-
56
-
57
-
58
-
59
-
60
-
61
-
62
-
63
-
64
-
65
-
66
-
67
-
68
-
69
-
70
-
71
-
72
-
73
-
74
-
75
-
76
-
77
-
78
-
79
-
80
-
81
-
82
-
83
-
84
-
85
-
86
-
87
-
88
-
89
-
90
-
91
-
 92
92 -
 93
93 -
 94
94 -
 95
95 -
 96
96 -
 97
97 -
 98
98 -
 99
99 -
 100
100 -
 101
101 -
 102
102 -
 103
103 -
 104
104 -
 105
105 -
 106
106 -
 107
107 -
 108
108 -
 109
109 -
 110
110 -
 111
111 -
 112
112 -
113
-
114
-
115
-
116
-
117
-
118
-
119
-
120
-
121
-
122
-
123
-
124
-
125
-
126
-
127
-
128
-
129
-
130
-
131
-
132
-
133
-
134
-
135
-
136
-
137
-
138
-
139
-
140
-
141
-
142
-
143
-
144
-
145
-
146
-
147
-
148
-
149
-
150
-
151
-
152
-
153
-
154
-
155
-
156
-
157
-
158
-
159
-
160
-
161
-
162
-
163
-
164
-
165
-
166
-
167
-
168
-
169
-
170
-
171
-
172
-
173
-
174
-
175
-
176
-
177
-
178
-
179
-
180
-
181
-
182
-
183
-
184
-
185
-
186
-
187
-
188
-
189
-
190
-
191
-
192
-
193
-
194
-
195
-
196
-
197
-
198
-
199
-
200
-
201
-
202
-
203
-
204
-
205
-
206
-
207
-
208
-
209
-
210
-
211
-
212
-
213
-
214
-
215
-
216
-
217
-
218
-
219
-
220
-
221
-
222
-
223
-
224
-
225
-
226
-
227
-
228
-
229
-
230
-
231
-
232
-
233
-
234
 |
 |

100
Operating and financial review
Operating and financial review continued
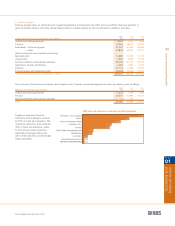
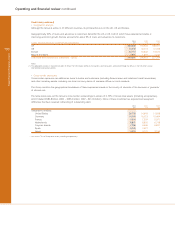
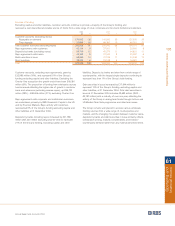
lCross border exposures
Cross border exposures are defined as loans to banks and customers (including finance lease and instalment credit receivables)
and other monetary assets, including non-local currency claims of overseas offices on local residents.
The Group monitors the geographical breakdown of these exposures based on the country of domicile of the borrower or guarantor
of ultimate risk.
The table below sets out the Group’s cross border outstandings in excess of 0.75% of Group total assets (including acceptances),
which totalled £583.8 billion (2003 – £455.0 billion; 2002 – £413.6 billion). None of these countries has experienced repayment
difficulties that have required refinancing of outstanding debt.
2004 2003 2002
£m £m £m
Geographic analysis:
United States 28,795 14,618 11,658
Germany 14,050 15,073 10,464
France 9,604 7,524 5,971
Netherlands 8,871 6,830 6,318
Cayman Islands 7,258 6,666 6,897
Spain 5,249 3,421 *
Japan 4,610 4,141 3,156
* Less than 0.75% of Group total assets (including acceptances).
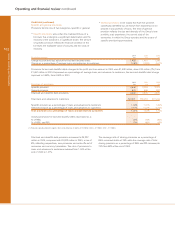
2004 2003 2002
Loans and advances to customers by geography £m £m £m
UK 240,642 194,545 168,931
US 74,045 40,373 41,008
Europe 32,113 19,842 15,572
Rest of the World 2,891 1,693 1,733
Total loans and advances to customers – gross 349,691 256,453 227,244
Notes:
(1) The geographic analysis is based on location of office. The UK includes domestic transactions and transactions conducted through the offices in the UK which service
international banking transactions.
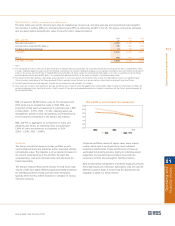
Credit risk (continued)
lGeographic analysis
Although the Group is active in 27 different countries, its principal focus is on the UK, US and Europe.
Geographically, 90% of loans and advances to customers fall within the UK or US, both of which have experienced stable or
improving economic growth. Europe accounts for about 9% of loans and advances to customers.