RBS 2004 Annual Report Download - page 192
Download and view the complete annual report
Please find page 192 of the 2004 RBS annual report below. You can navigate through the pages in the report by either clicking on the pages listed below, or by using the keyword search tool below to find specific information within the annual report.-
 1
1 -
2
-
3
-
4
-
5
-
6
-
7
-
8
-
9
-
10
-
11
-
12
-
13
-
14
-
15
-
16
-
17
-
18
-
19
-
20
-
21
-
22
-
23
-
24
-
25
-
26
-
27
-
28
-
29
-
30
-
31
-
32
-
33
-
34
-
35
-
36
-
37
-
38
-
39
-
40
-
41
-
42
-
43
-
44
-
45
-
46
-
47
-
48
-
49
-
50
-
51
-
52
-
53
-
54
-
55
-
56
-
57
-
58
-
59
-
60
-
61
-
62
-
63
-
64
-
65
-
66
-
67
-
68
-
69
-
70
-
71
-
72
-
73
-
74
-
75
-
76
-
77
-
78
-
79
-
80
-
81
-
82
-
83
-
84
-
85
-
86
-
87
-
88
-
89
-
90
-
91
-
92
-
93
-
94
-
95
-
96
-
97
-
98
-
99
-
100
-
101
-
102
-
103
-
104
-
105
-
106
-
107
-
108
-
109
-
110
-
111
-
112
-
113
-
114
-
115
-
116
-
117
-
118
-
119
-
120
-
121
-
122
-
123
-
124
-
125
-
126
-
127
-
128
-
129
-
130
-
131
-
132
-
133
-
134
-
135
-
136
-
137
-
138
-
139
-
140
-
141
-
142
-
143
-
144
-
145
-
146
-
147
-
148
-
149
-
150
-
151
-
152
-
153
-
154
-
155
-
156
-
157
-
158
-
159
-
160
-
161
-
162
-
163
-
164
-
165
-
166
-
167
-
168
-
169
-
170
-
171
-
172
-
173
-
174
-
175
-
176
-
177
-
178
-
179
-
180
-
181
-
 182
182 -
 183
183 -
 184
184 -
 185
185 -
 186
186 -
 187
187 -
 188
188 -
 189
189 -
 190
190 -
 191
191 -
 192
192 -
 193
193 -
 194
194 -
 195
195 -
 196
196 -
 197
197 -
 198
198 -
 199
199 -
 200
200 -
 201
201 -
 202
202 -
203
-
204
-
205
-
206
-
207
-
208
-
209
-
210
-
211
-
212
-
213
-
214
-
215
-
216
-
217
-
218
-
219
-
220
-
221
-
222
-
223
-
224
-
225
-
226
-
227
-
228
-
229
-
230
-
231
-
232
-
233
-
234
 |
 |

190
Notes on the accounts
Notes on the accounts continued
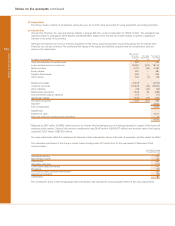
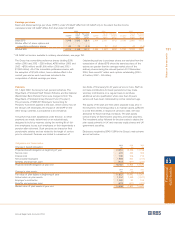
53 Significant differences between UK and US generally accepted accounting principles (continued)
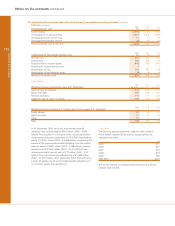
Selected figures in accordance with US GAAP
The following tables summarise the significant adjustments to consolidated net income available for ordinary shareholders and
shareholders’ equity which would result from the application of US GAAP instead of UK GAAP. Where applicable, the adjustments
are stated gross of tax with the tax effect shown separately in total.
2004 2003 2002
Consolidated statement of income £m £m £m
Profit attributable to ordinary shareholders – UK GAAP 4,256 2,254 2,034
Adjustments in respect of:
Acquisition accounting 66 33 —
Amortisation of intangible assets 780 721 681
Property revaluation and depreciation (69) (41) (18)
Leasehold property provisions (19) 83 —
Loan origination (85) (47) (72)
Pension costs (285) (286) (121)
Long-term assurance business (27) (57) (37)
Extinguishment of liabilities (94) (84) —
Leasing (35) (53) (71)
Securities (170) 49 —
Derivatives and hedging (437) 232 770
Software development costs (261) (300) 283
Share-based payment (26) (32) —
Consolidation (29) (60) —
Tax effect on the above adjustments 395 165 (261)
Deferred taxation (12) (13) (80)
Net income available for ordinary shareholders – US GAAP 3,948 2,564 3,108
2004 2003
Consolidated shareholders’ equity £m £m
Shareholders’ funds – UK GAAP 31,865 26,098
Adjustments in respect of:
Acquisition accounting 517 451
Intangible assets 3,002 2,222
Property revaluation and depreciation (262) (249)
Leasehold property provisions 64 83
Proposed dividend 1,308 1,059
Loan origination (373) (288)
Pension costs 190 2,828
Long-term assurance business (205) (178)
Extinguishment of liabilities (178) (84)
Leasing (253) (218)
Securities 134 232
Derivatives and hedging 238 161
Software development costs 399 660
Share-based payment (58) (32)
Consolidation (89) (60)
Tax effect on cumulative UK/US GAAP adjustments (733) (1,128)
Tax effect on other comprehensive income 684 155
Deferred tax (59) (47)
Shareholders’ equity – US GAAP 36,191 31,665
Prior periods have been restated following the implementation of FRS 17 and the reclassification of perpetual regulatory securities.
Total assets under US GAAP, adjusted to reflect the consolidation of variable interest entities, inclusion of acceptances, provisions for
contingent liabilities and commitments, the fair value of financial guarantees and the grossing-up of certain netting arrangements under
UK GAAP, together with the effect of adjustments made to net income and shareholders’ funds, were £631 billion (2003 – £488 billion).