Regions Bank 2008 Annual Report Download - page 103
Download and view the complete annual report
Please find page 103 of the 2008 Regions Bank annual report below. You can navigate through the pages in the report by either clicking on the pages listed below, or by using the keyword search tool below to find specific information within the annual report.-
 1
1 -
2
-
3
-
4
-
5
-
6
-
7
-
8
-
9
-
10
-
11
-
12
-
13
-
14
-
15
-
16
-
17
-
18
-
19
-
20
-
21
-
22
-
23
-
24
-
25
-
26
-
27
-
28
-
29
-
30
-
31
-
32
-
33
-
34
-
35
-
36
-
37
-
38
-
39
-
40
-
41
-
42
-
43
-
44
-
45
-
46
-
47
-
48
-
49
-
50
-
51
-
52
-
53
-
54
-
55
-
56
-
57
-
58
-
59
-
60
-
61
-
62
-
63
-
64
-
65
-
66
-
67
-
68
-
69
-
70
-
71
-
72
-
73
-
74
-
75
-
76
-
77
-
78
-
79
-
80
-
81
-
82
-
83
-
84
-
85
-
86
-
87
-
88
-
89
-
90
-
91
-
92
-
 93
93 -
 94
94 -
 95
95 -
 96
96 -
 97
97 -
 98
98 -
 99
99 -
 100
100 -
 101
101 -
 102
102 -
 103
103 -
 104
104 -
 105
105 -
 106
106 -
 107
107 -
 108
108 -
 109
109 -
 110
110 -
 111
111 -
 112
112 -
 113
113 -
114
-
115
-
116
-
117
-
118
-
119
-
120
-
121
-
122
-
123
-
124
-
125
-
126
-
127
-
128
-
129
-
130
-
131
-
132
-
133
-
134
-
135
-
136
-
137
-
138
-
139
-
140
-
141
-
142
-
143
-
144
-
145
-
146
-
147
-
148
-
149
-
150
-
151
-
152
-
153
-
154
-
155
-
156
-
157
-
158
-
159
-
160
-
161
-
162
-
163
-
164
-
165
-
166
-
167
-
168
-
169
-
170
-
171
-
172
-
173
-
174
-
175
-
176
-
177
-
178
-
179
-
180
-
181
-
182
-
183
-
184
 |
 |

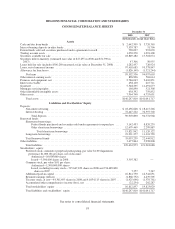
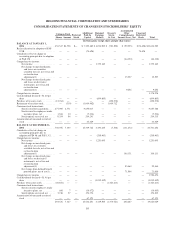
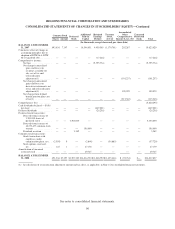
REGIONS FINANCIAL CORPORATION AND SUBSIDIARIES
CONSOLIDATED BALANCE SHEETS
December 31
2008 2007
(In thousands, except share data)
Assets
Cash and due from banks ..................................................... $ 2,642,509 $ 3,720,365
Interest-bearing deposits in other banks .......................................... 7,539,787 31,706
Federal funds sold and securities purchased under agreements to resell ................. 790,097 993,070
Trading account assets ....................................................... 1,050,270 1,091,400
Securities available for sale ................................................... 18,849,482 17,318,074
Securities held to maturity (estimated fair value of $47,655 in 2008 and $51,790 in
2007) ................................................................... 47,306 50,935
Loans held for sale (includes $506,260 measured at fair value at December 31, 2008) ..... 1,282,437 720,924
Loans, net of unearned income ................................................ 97,418,685 95,378,847
Allowance for loan losses ..................................................... (1,826,149) (1,321,244)
Net loans .............................................................. 95,592,536 94,057,603
Other interest-earning assets .................................................. 896,906 504,614
Premises and equipment, net .................................................. 2,786,043 2,610,851
Interest receivable ........................................................... 458,120 615,711
Goodwill .................................................................. 5,548,295 11,491,673
Mortgage servicing rights ..................................................... 160,890 321,308
Other identifiable intangible assets ............................................. 638,392 759,832
Other assets ................................................................ 7,964,740 6,753,651
Total assets ............................................................ $146,247,810 $141,041,717
Liabilities and Stockholders’ Equity
Deposits:
Non-interest-bearing ..................................................... $ 18,456,668 $ 18,417,266
Interest-bearing ......................................................... 72,447,222 76,357,702
Total deposits ...................................................... 90,903,890 94,774,968
Borrowed funds:
Short-term borrowings:
Federal funds purchased and securities sold under agreements to repurchase .... 3,142,493 8,820,235
Other short-term borrowings .......................................... 12,679,469 2,299,887
Total short-term borrowings ...................................... 15,821,962 11,120,122
Long-term borrowings ................................................... 19,231,277 11,324,790
Total borrowed funds .................................................... 35,053,239 22,444,912
Other liabilities ............................................................. 3,477,844 3,998,808
Total liabilities ......................................................... 129,434,973 121,218,688
Stockholders’ equity:
Preferred stock, cumulative perpetual participating, par value $1.00 (liquidation
preference $1,000.00) per share, net of discount:
Authorized—10,000,000 shares
Issued—3,500,000 shares in 2008 ...................................... 3,307,382 —
Common stock, par value $.01 per share:
Authorized—1,500,000,000 shares
Issued, including treasury stock—735,667,650 shares in 2008 and 734,689,800
shares in 2007 .................................................... 7,357 7,347
Additional paid-in capital ................................................. 16,814,730 16,544,651
Retained earnings (deficit) ................................................ (1,868,752) 4,439,505
Treasury stock, at cost—44,301,693 shares in 2008 and 41,054,113 shares in 2007 . . . (1,425,646) (1,370,761)
Accumulated other comprehensive income (loss), net .......................... (22,234) 202,287
Total stockholders’ equity ................................................ 16,812,837 19,823,029
Total liabilities and stockholders’ equity ..................................... $146,247,810 $141,041,717
See notes to consolidated financial statements.
93