Regions Bank 2008 Annual Report Download - page 52
Download and view the complete annual report
Please find page 52 of the 2008 Regions Bank annual report below. You can navigate through the pages in the report by either clicking on the pages listed below, or by using the keyword search tool below to find specific information within the annual report.-
 1
1 -
2
-
3
-
4
-
5
-
6
-
7
-
8
-
9
-
10
-
11
-
12
-
13
-
14
-
15
-
16
-
17
-
18
-
19
-
20
-
21
-
22
-
23
-
24
-
25
-
26
-
27
-
28
-
29
-
30
-
31
-
32
-
33
-
34
-
35
-
36
-
37
-
38
-
39
-
40
-
41
-
 42
42 -
 43
43 -
 44
44 -
 45
45 -
 46
46 -
 47
47 -
 48
48 -
 49
49 -
 50
50 -
 51
51 -
 52
52 -
 53
53 -
 54
54 -
 55
55 -
 56
56 -
 57
57 -
 58
58 -
 59
59 -
 60
60 -
 61
61 -
 62
62 -
63
-
64
-
65
-
66
-
67
-
68
-
69
-
70
-
71
-
72
-
73
-
74
-
75
-
76
-
77
-
78
-
79
-
80
-
81
-
82
-
83
-
84
-
85
-
86
-
87
-
88
-
89
-
90
-
91
-
92
-
93
-
94
-
95
-
96
-
97
-
98
-
99
-
100
-
101
-
102
-
103
-
104
-
105
-
106
-
107
-
108
-
109
-
110
-
111
-
112
-
113
-
114
-
115
-
116
-
117
-
118
-
119
-
120
-
121
-
122
-
123
-
124
-
125
-
126
-
127
-
128
-
129
-
130
-
131
-
132
-
133
-
134
-
135
-
136
-
137
-
138
-
139
-
140
-
141
-
142
-
143
-
144
-
145
-
146
-
147
-
148
-
149
-
150
-
151
-
152
-
153
-
154
-
155
-
156
-
157
-
158
-
159
-
160
-
161
-
162
-
163
-
164
-
165
-
166
-
167
-
168
-
169
-
170
-
171
-
172
-
173
-
174
-
175
-
176
-
177
-
178
-
179
-
180
-
181
-
182
-
183
-
184
 |
 |

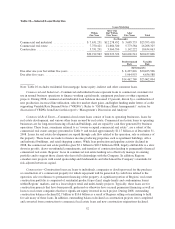
For further discussion of the total allowance for credit losses, see the “Risk Management” section found
later in this report and Note 7 “Allowance for Credit Losses” to the consolidated financial statements.
NON-INTEREST INCOME
The following section contains a discussion of non-interest income from continuing operations and excludes
EquiFirst, which is reported separately as discontinued operations in the consolidated statements of operations.
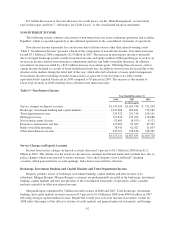
Non-interest income represents fees and income derived from sources other than interest-earning assets.
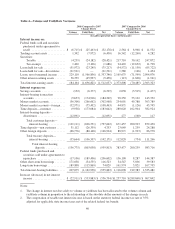
Table 5 “Non-Interest Income” provides a detail of the components of non-interest income. Non-interest income
totaled $3.1 billion in 2008 compared to $2.9 billion in 2007. The increase in non-interest income is primarily
due to stronger brokerage results, mainly from fixed-income and equity markets at Morgan Keegan, as well as an
increase in income derived from insurance commissions and fees and bank-owned life insurance. In addition,
non-interest income was aided by a $101 million increase in securities gains. Offsetting these increases, service
charge income declined as a result of lower insufficient funds fees. In addition, trust income decreased due to the
disarray in the markets during the latter half of the year, which affected valuations of assets under management.
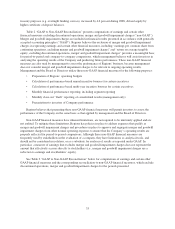
Non-interest income (excluding securities transactions) as a percent of total revenue (on a fully taxable-
equivalent basis) equaled 43 percent in 2008 compared to 39 percent in 2007. The increase is due mainly to
lower total revenues in 2008 resulting from a decline in net interest income.
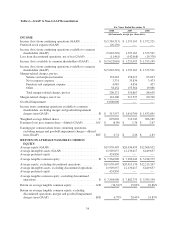
Table 5—Non-Interest Income
Year Ended December 31
2008 2007 2006
(In thousands)
Service charges on deposit accounts ............................. $1,147,959 $1,162,740 $ 721,998
Brokerage, investment banking and capital markets ................. 1,027,468 894,621 716,983
Trust department income ...................................... 233,522 251,319 158,161
Mortgage income ............................................ 137,676 135,704 178,688
Net securities gains (losses) ................................... 92,495 (8,553) 8,123
Insurance commissions and fees ................................ 110,069 99,365 85,547
Bank-owned life insurance .................................... 78,341 62,021 11,853
Other miscellaneous income ................................... 245,701 258,618 148,367
$3,073,231 $2,855,835 $2,029,720
Service Charges on Deposit Accounts
Income from service charges on deposit accounts decreased 1 percent to $1.1 billion in 2008 from $1.2
billion in 2007. This decline was the result of a decrease in consumer insufficient funds and overdraft fees, due to
policy changes which were enacted to retain customers. Also, the Company’s new LifeGreen®checking
accounts, which generated new account openings, had a lower associated fee structure.
Brokerage, Investment Banking and Capital Markets and Trust Department Income
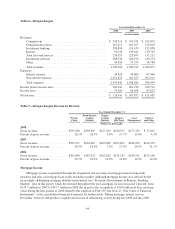
Regions’ primary source of brokerage, investment banking, capital markets and trust revenue is its
subsidiary, Morgan Keegan. Morgan Keegan’s revenues are predominantly recorded in the brokerage, investment
banking, capital markets and trust income lines of the consolidated statements of operations, while a smaller
portion is reported in other non-interest income.
Morgan Keegan contributed $1.3 billion in total revenues in 2008 and 2007. Total brokerage, investment
banking, and capital markets revenues increased 15 percent to $1.0 billion in 2008 from $894.6 million in 2007,
reflecting stronger capital markets income. Despite the overall year-over-year increase in revenues, results for
2008 reflect the impact of the effective closure of credit markets and general upheaval in domestic and foreign
42