Regions Bank 2008 Annual Report Download - page 128
Download and view the complete annual report
Please find page 128 of the 2008 Regions Bank annual report below. You can navigate through the pages in the report by either clicking on the pages listed below, or by using the keyword search tool below to find specific information within the annual report.-
 1
1 -
2
-
3
-
4
-
5
-
6
-
7
-
8
-
9
-
10
-
11
-
12
-
13
-
14
-
15
-
16
-
17
-
18
-
19
-
20
-
21
-
22
-
23
-
24
-
25
-
26
-
27
-
28
-
29
-
30
-
31
-
32
-
33
-
34
-
35
-
36
-
37
-
38
-
39
-
40
-
41
-
42
-
43
-
44
-
45
-
46
-
47
-
48
-
49
-
50
-
51
-
52
-
53
-
54
-
55
-
56
-
57
-
58
-
59
-
60
-
61
-
62
-
63
-
64
-
65
-
66
-
67
-
68
-
69
-
70
-
71
-
72
-
73
-
74
-
75
-
76
-
77
-
78
-
79
-
80
-
81
-
82
-
83
-
84
-
85
-
86
-
87
-
88
-
89
-
90
-
91
-
92
-
93
-
94
-
95
-
96
-
97
-
98
-
99
-
100
-
101
-
102
-
103
-
104
-
105
-
106
-
107
-
108
-
109
-
110
-
111
-
112
-
113
-
114
-
115
-
116
-
117
-
 118
118 -
 119
119 -
 120
120 -
 121
121 -
 122
122 -
 123
123 -
 124
124 -
 125
125 -
 126
126 -
 127
127 -
 128
128 -
 129
129 -
 130
130 -
 131
131 -
 132
132 -
 133
133 -
 134
134 -
 135
135 -
 136
136 -
 137
137 -
 138
138 -
139
-
140
-
141
-
142
-
143
-
144
-
145
-
146
-
147
-
148
-
149
-
150
-
151
-
152
-
153
-
154
-
155
-
156
-
157
-
158
-
159
-
160
-
161
-
162
-
163
-
164
-
165
-
166
-
167
-
168
-
169
-
170
-
171
-
172
-
173
-
174
-
175
-
176
-
177
-
178
-
179
-
180
-
181
-
182
-
183
-
184
 |
 |

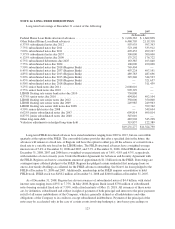
credit supporting these conduit transactions of zero and $41.5 million at December 31, 2008 and 2007,
respectively. No gains or losses were recognized on commercial loans sold to third-party conduits nor was any
retained interest recorded due to the relatively short life of the commercial loans sold into the conduits.
Also during 2008, Regions exercised a clean-up call on an indirect auto loan conduit that had approximately
$3.2 million in securitized loans as of December 31, 2007.
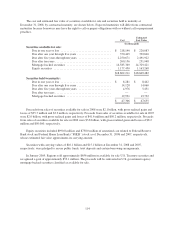
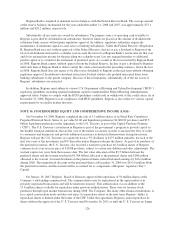
The following table summarizes amounts recognized in the consolidated financial statements related to
securitization transactions for the years ended December 31:
2008 2007 2006
(In thousands )
Proceeds from securitizations ..................... $41,505 $423,230 $47,557
Net gains ...................................... — 2,178 —
Servicing fees received ........................... 1,079 3,130 4,229
Other cash (outflows) inflows ..................... (88) (183) 336
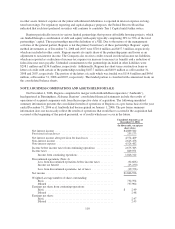
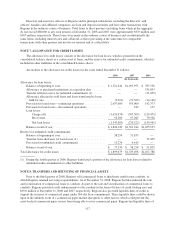
An analysis of mortgage servicing rights for the years ended December 31 is presented below:
2008 2007
(In thousands)
Balance at beginning of year .............................. $368,654 $416,217
Amounts capitalized ..................................... 58,632 56,931
Sale of servicing assets .................................. (71,172) (25,577)
Amortization .......................................... (75,430) (78,917)
280,684 368,654
Valuation allowance ..................................... (119,794) (47,346)
Balance at end of year ................................... $160,890 $321,308
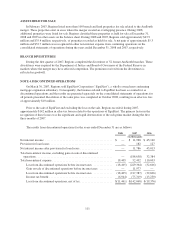
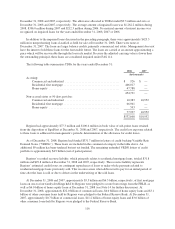
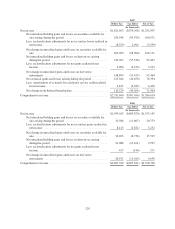
The changes in the valuation allowance for mortgage servicing assets were as follows for the years ended
December 31:
2008 2007
(In thousands)
Balance at beginning of year ................................ $ 47,346 $41,346
Release of impairment—sale of MSRs ........................ (12,552) —
Impairment of mortgage servicing rights ...................... 85,000 6,000
Balance at end of year ..................................... $119,794 $47,346
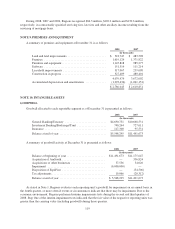
Data and assumptions used in the fair value calculation related to mortgage servicing rights for the years
ended December 31 are as follows:
2008 2007
Weighted-average prepayment speeds ............................. 597 393
Weighted-average discount rate .................................. 10.30% 9.80%
Weighted-average coupon interest rate ............................. 6.13% 6.18%
Weighted-average remaining maturity (months) ..................... 279 278
Weighted-average servicing fee (basis points) ....................... 28.80 30.96
The estimated fair values of capitalized mortgage servicing rights were $160.9 million and $321.3 million at
December 31, 2008 and 2007, respectively. In 2008, 2007 and 2006, Regions’ amortization of mortgage
servicing rights was $75.4 million, $78.9 million and $70.6 million, respectively.
118