Regions Bank 2008 Annual Report Download - page 41
Download and view the complete annual report
Please find page 41 of the 2008 Regions Bank annual report below. You can navigate through the pages in the report by either clicking on the pages listed below, or by using the keyword search tool below to find specific information within the annual report.-
 1
1 -
2
-
3
-
4
-
5
-
6
-
7
-
8
-
9
-
10
-
11
-
12
-
13
-
14
-
15
-
16
-
17
-
18
-
19
-
20
-
21
-
22
-
23
-
24
-
25
-
26
-
27
-
28
-
29
-
30
-
 31
31 -
 32
32 -
 33
33 -
 34
34 -
 35
35 -
 36
36 -
 37
37 -
 38
38 -
 39
39 -
 40
40 -
 41
41 -
 42
42 -
 43
43 -
 44
44 -
 45
45 -
 46
46 -
 47
47 -
 48
48 -
 49
49 -
 50
50 -
 51
51 -
52
-
53
-
54
-
55
-
56
-
57
-
58
-
59
-
60
-
61
-
62
-
63
-
64
-
65
-
66
-
67
-
68
-
69
-
70
-
71
-
72
-
73
-
74
-
75
-
76
-
77
-
78
-
79
-
80
-
81
-
82
-
83
-
84
-
85
-
86
-
87
-
88
-
89
-
90
-
91
-
92
-
93
-
94
-
95
-
96
-
97
-
98
-
99
-
100
-
101
-
102
-
103
-
104
-
105
-
106
-
107
-
108
-
109
-
110
-
111
-
112
-
113
-
114
-
115
-
116
-
117
-
118
-
119
-
120
-
121
-
122
-
123
-
124
-
125
-
126
-
127
-
128
-
129
-
130
-
131
-
132
-
133
-
134
-
135
-
136
-
137
-
138
-
139
-
140
-
141
-
142
-
143
-
144
-
145
-
146
-
147
-
148
-
149
-
150
-
151
-
152
-
153
-
154
-
155
-
156
-
157
-
158
-
159
-
160
-
161
-
162
-
163
-
164
-
165
-
166
-
167
-
168
-
169
-
170
-
171
-
172
-
173
-
174
-
175
-
176
-
177
-
178
-
179
-
180
-
181
-
182
-
183
-
184
 |
 |
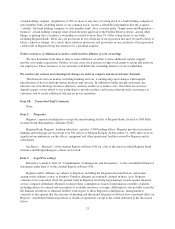
2008 OVERVIEW
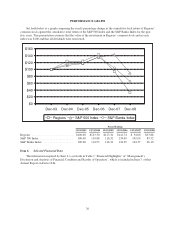
The year ended December 31, 2008 was an extremely tumultuous year for the U.S. economy and, more
specifically, for the financial services industry. Deteriorating home values, among other factors, provided a
catalyst for declining valuations across nearly all asset classes, including loans and securities. The property value
declines, which began in late 2007, continued to build throughout 2008. While Regions did not have material
exposure to many of the issues that plagued the industry (e.g., sub-prime loans, structured investment vehicles,
collateralized debt obligations), the Company’s exposure to the residential housing sector, primarily within its
commercial real estate and construction loan portfolios, pressured its loan portfolio, resulting in increased credit
costs and other real estate expenses. In another significant event, the results of goodwill impairment testing in the
fourth quarter of 2008 indicated that the estimated fair value of Regions’ General Banking/Treasury reporting
unit goodwill was less than its book value, requiring a $6.0 billion non-cash charge to earnings.
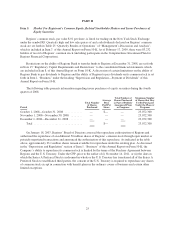
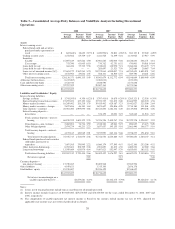
As a result of these factors, Regions reported a net loss from continuing operations of $5.6 billion or $8.07
per diluted common share in 2008. Not included in this amount was an $11.5 million after-tax loss related to
EquiFirst, which was accounted for as discontinued operations. Included in the 2008 net loss was a $6.0 billion
goodwill impairment charge ($8.63 per diluted share) and $124.1 million in after-tax merger-related expenses
($0.18 per diluted share). Net income from continuing operations was $1.95 per diluted share in 2007, including
a reduction of $0.31 per diluted share related to $217.5 million in after-tax merger-related expenses. Excluding
merger-related charges and goodwill impairment charges, annual earnings per common share from continuing
operations was $0.74 in 2008 as compared to $2.26 in 2007. Significant drivers of 2008 results include a much
higher provision for loan losses and lower net interest income. Offsetting to some extent was Regions’ solid fee
income, including revenues from Morgan Keegan. See Table 2 “GAAP to Non-GAAP Reconciliation” for
additional details.
As a result of the large earnings impact from the goodwill impairment charge, return measures, such as
return on average tangible common stockholders’ equity, were not meaningful for 2008 on a generally accepted
accounting principles (“GAAP”) basis. Excluding the goodwill impairment charge, merger-related charges and
discontinued operations, return on average tangible common stockholders’ equity was 6.79 percent for the year
ended December 31, 2008, compared to 20.43 percent for the year ended December 31, 2007. See Table 2
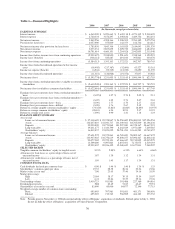
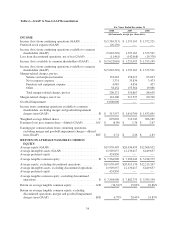
“GAAP to Non-GAAP Reconciliation” for additional details and Table 1 “Financial Highlights” for additional
ratios.
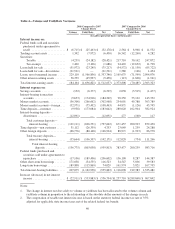
Net interest income was $3.8 billion in 2008 compared to $4.4 billion in 2007. The decrease resulted in a
lower net interest margin, which declined to 3.23 percent during 2008 compared to 3.79 percent in 2007. The net
interest margin was negatively impacted primarily by factors directly and indirectly associated with the erosion
of economic and industry conditions in late 2007 and throughout 2008. These factors include an unfavorable
variation in the general level and shape of the yield curve (exemplified by recent Federal Reserve interest rate
reductions), intensification of price-based competition for retail deposits, disintermediation of deposits into other
non-bank asset classes, rate increases for new debt issuances, and rising non-performing asset levels. Moreover,
the costs of maintenance of the Company’s liquidity profile in the presently stressed environment (including
maintaining prudent levels of excess liquidity) have increased, further pressuring the net interest margin.
Net charge-offs totaled $1.5 billion, or 1.59 percent of average loans in 2008 compared to $270.5 million, or
0.29 percent of average loans in 2007. The increased loss rate resulted from deteriorating economic conditions
during 2008, especially related to the housing sector. More specifically, approximately $639.0 million of 2008
net charges-offs were related to non-performing loan dispositions or transfers to held for sale as compared to
none in 2007. Non-performing assets increased $853.9 million between December 31, 2007 and December 31,
2008 to $1.7 billion, primarily due to continued weakness in the Company’s residential homebuilder portfolio,
which began experiencing significant pressure toward the end of 2007. This pressure was due to a combination of
declining residential real estate demand and resulting price and collateral value declines in certain of the
Company’s markets, particularly areas of Florida and Atlanta, Georgia. Condominium loans, mainly in Florida,
31