Regions Bank 2008 Annual Report Download - page 98
Download and view the complete annual report
Please find page 98 of the 2008 Regions Bank annual report below. You can navigate through the pages in the report by either clicking on the pages listed below, or by using the keyword search tool below to find specific information within the annual report.-
 1
1 -
2
-
3
-
4
-
5
-
6
-
7
-
8
-
9
-
10
-
11
-
12
-
13
-
14
-
15
-
16
-
17
-
18
-
19
-
20
-
21
-
22
-
23
-
24
-
25
-
26
-
27
-
28
-
29
-
30
-
31
-
32
-
33
-
34
-
35
-
36
-
37
-
38
-
39
-
40
-
41
-
42
-
43
-
44
-
45
-
46
-
47
-
48
-
49
-
50
-
51
-
52
-
53
-
54
-
55
-
56
-
57
-
58
-
59
-
60
-
61
-
62
-
63
-
64
-
65
-
66
-
67
-
68
-
69
-
70
-
71
-
72
-
73
-
74
-
75
-
76
-
77
-
78
-
79
-
80
-
81
-
82
-
83
-
84
-
85
-
86
-
87
-
 88
88 -
 89
89 -
 90
90 -
 91
91 -
 92
92 -
 93
93 -
 94
94 -
 95
95 -
 96
96 -
 97
97 -
 98
98 -
 99
99 -
 100
100 -
 101
101 -
 102
102 -
 103
103 -
 104
104 -
 105
105 -
 106
106 -
 107
107 -
 108
108 -
109
-
110
-
111
-
112
-
113
-
114
-
115
-
116
-
117
-
118
-
119
-
120
-
121
-
122
-
123
-
124
-
125
-
126
-
127
-
128
-
129
-
130
-
131
-
132
-
133
-
134
-
135
-
136
-
137
-
138
-
139
-
140
-
141
-
142
-
143
-
144
-
145
-
146
-
147
-
148
-
149
-
150
-
151
-
152
-
153
-
154
-
155
-
156
-
157
-
158
-
159
-
160
-
161
-
162
-
163
-
164
-
165
-
166
-
167
-
168
-
169
-
170
-
171
-
172
-
173
-
174
-
175
-
176
-
177
-
178
-
179
-
180
-
181
-
182
-
183
-
184
 |
 |
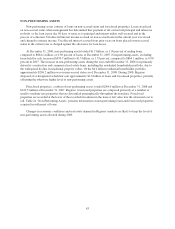
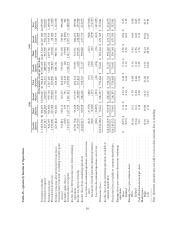
At December 31, 2007, non-performing assets totaled $864.1 million, or 0.90 percent of ending loans,
compared to $379.1 million, or 0.40 percent of loans, at December 31, 2006. The increase in non-performing
assets was largely influenced by growth in non-performing loans in the fourth quarter of 2007 due to weakness in
the residential homebuilder portfolio. This pressure was due to a combination of declining residential demand
and resulting price and collateral value declines in certain of the Company’s markets, particularly areas of
Florida and Atlanta, Georgia.
Net charge-offs totaled $270.5 million, or 0.29 percent of average loans, in 2007 compared to 0.22 percent
in 2006. The increased loss rate resulted from deteriorating economic conditions during 2007, especially as
related to the housing sector. The provision for loan losses from continuing operations increased $412.6 million
to $555.0 million. Two primary factors led to the increase. Most notably, 2006 included just two months of
provision for loan losses added to the portfolio as a result of the November 2006 merger with AmSouth, while
the provision recorded in 2007 reflected the results of the newly merged Regions for the full year. In addition, the
provision rose due to an increase in management’s estimate of inherent losses in its residential homebuilder
portfolio. The allowance for credit losses increased $271.7 million to $1.4 billion or 1.45 percent of total loans in
2007, compared to $1.1 billion or 1.17 percent at year-end 2006. The increase in the allowance for credit losses
was due to the general economic environment and the deteriorating credit conditions.
88