Regions Bank 2008 Annual Report Download - page 177
Download and view the complete annual report
Please find page 177 of the 2008 Regions Bank annual report below. You can navigate through the pages in the report by either clicking on the pages listed below, or by using the keyword search tool below to find specific information within the annual report.-
 1
1 -
2
-
3
-
4
-
5
-
6
-
7
-
8
-
9
-
10
-
11
-
12
-
13
-
14
-
15
-
16
-
17
-
18
-
19
-
20
-
21
-
22
-
23
-
24
-
25
-
26
-
27
-
28
-
29
-
30
-
31
-
32
-
33
-
34
-
35
-
36
-
37
-
38
-
39
-
40
-
41
-
42
-
43
-
44
-
45
-
46
-
47
-
48
-
49
-
50
-
51
-
52
-
53
-
54
-
55
-
56
-
57
-
58
-
59
-
60
-
61
-
62
-
63
-
64
-
65
-
66
-
67
-
68
-
69
-
70
-
71
-
72
-
73
-
74
-
75
-
76
-
77
-
78
-
79
-
80
-
81
-
82
-
83
-
84
-
85
-
86
-
87
-
88
-
89
-
90
-
91
-
92
-
93
-
94
-
95
-
96
-
97
-
98
-
99
-
100
-
101
-
102
-
103
-
104
-
105
-
106
-
107
-
108
-
109
-
110
-
111
-
112
-
113
-
114
-
115
-
116
-
117
-
118
-
119
-
120
-
121
-
122
-
123
-
124
-
125
-
126
-
127
-
128
-
129
-
130
-
131
-
132
-
133
-
134
-
135
-
136
-
137
-
138
-
139
-
140
-
141
-
142
-
143
-
144
-
145
-
146
-
147
-
148
-
149
-
150
-
151
-
152
-
153
-
154
-
155
-
156
-
157
-
158
-
159
-
160
-
161
-
162
-
163
-
164
-
165
-
166
-
 167
167 -
 168
168 -
 169
169 -
 170
170 -
 171
171 -
 172
172 -
 173
173 -
 174
174 -
 175
175 -
 176
176 -
 177
177 -
 178
178 -
 179
179 -
 180
180 -
 181
181 -
 182
182 -
 183
183 -
 184
184
 |
 |

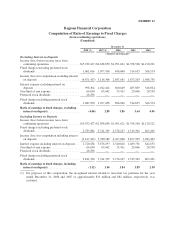
EXHIBIT 12
Regions Financial Corporation
Computation of Ratio of Earnings to Fixed Charges
(from continuing operations)
(Unaudited)
December 31
2008 (1) 2007 (1) 2006 2005 2004
(Amounts in thousands)
Excluding Interest on Deposits
Income (loss) before income taxes from
continuing operations .................... $(5,932,427) $2,038,850 $1,991,621 $1,358,568 $1,120,221
Fixed charges excluding preferred stock
dividends ............................. 1,061,014 1,077,456 696,060 514,635 366,574
Income (loss) for computation excluding interest
on deposits ............................ (4,871,413) 3,116,306 2,687,681 1,873,203 1,486,795
Interest expense excluding interest on
deposits .............................. 996,364 1,012,414 660,649 485,029 346,024
One-third of rent expense ................... 64,650 65,042 35,411 29,606 20,550
Preferred stock dividends ................... 26,236 ————
Fixed charges including preferred stock
dividends ............................. 1,087,250 1,077,456 696,060 514,635 366,574
Ratio of earnings to fixed charges, excluding
interest on deposits ..................... (4.48) 2.89 3.86 3.64 4.06
Including Interest on Deposits
Income (loss) before income taxes from
continuing operations .................... $(5,932,427) $2,038,850 $1,991,621 $1,358,568 $1,120,221
Fixed charges excluding preferred stock
dividends ............................. 2,785,084 3,741,339 2,376,227 1,519,362 863,201
Income (loss) for computation including interest
on deposits ............................ (3,147,343) 5,780,189 4,367,848 2,877,930 1,983,422
Interest expense including interest on deposits . . 2,720,434 3,676,297 2,340,816 1,489,756 842,651
One-third of rent expense ................... 64,650 65,042 35,411 29,606 20,550
Preferred stock dividends ................... 26,236 ————
Fixed charges including preferred stock
dividends ............................. 2,811,320 3,741,339 2,376,227 1,519,362 863,201
Ratio of earnings to fixed charges, including
interest on deposits ..................... (1.12) 1.54 1.84 1.89 2.30
(1) For purposes of this computation, the recognized interest related to uncertain tax positions for the year
ended December 31, 2008 and 2007 of approximately $31 million and $82 million, respectively, was
excluded.