Regions Bank 2008 Annual Report Download - page 71
Download and view the complete annual report
Please find page 71 of the 2008 Regions Bank annual report below. You can navigate through the pages in the report by either clicking on the pages listed below, or by using the keyword search tool below to find specific information within the annual report.-
 1
1 -
2
-
3
-
4
-
5
-
6
-
7
-
8
-
9
-
10
-
11
-
12
-
13
-
14
-
15
-
16
-
17
-
18
-
19
-
20
-
21
-
22
-
23
-
24
-
25
-
26
-
27
-
28
-
29
-
30
-
31
-
32
-
33
-
34
-
35
-
36
-
37
-
38
-
39
-
40
-
41
-
42
-
43
-
44
-
45
-
46
-
47
-
48
-
49
-
50
-
51
-
52
-
53
-
54
-
55
-
56
-
57
-
58
-
59
-
60
-
 61
61 -
 62
62 -
 63
63 -
 64
64 -
 65
65 -
 66
66 -
 67
67 -
 68
68 -
 69
69 -
 70
70 -
 71
71 -
 72
72 -
 73
73 -
 74
74 -
 75
75 -
 76
76 -
 77
77 -
 78
78 -
 79
79 -
 80
80 -
 81
81 -
82
-
83
-
84
-
85
-
86
-
87
-
88
-
89
-
90
-
91
-
92
-
93
-
94
-
95
-
96
-
97
-
98
-
99
-
100
-
101
-
102
-
103
-
104
-
105
-
106
-
107
-
108
-
109
-
110
-
111
-
112
-
113
-
114
-
115
-
116
-
117
-
118
-
119
-
120
-
121
-
122
-
123
-
124
-
125
-
126
-
127
-
128
-
129
-
130
-
131
-
132
-
133
-
134
-
135
-
136
-
137
-
138
-
139
-
140
-
141
-
142
-
143
-
144
-
145
-
146
-
147
-
148
-
149
-
150
-
151
-
152
-
153
-
154
-
155
-
156
-
157
-
158
-
159
-
160
-
161
-
162
-
163
-
164
-
165
-
166
-
167
-
168
-
169
-
170
-
171
-
172
-
173
-
174
-
175
-
176
-
177
-
178
-
179
-
180
-
181
-
182
-
183
-
184
 |
 |

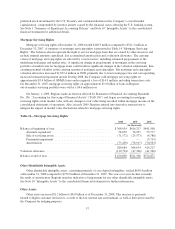
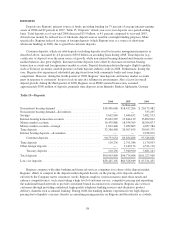
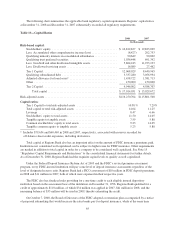
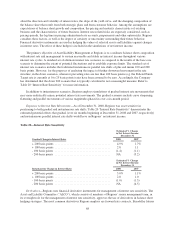
Table 17—Selected Short-Term Borrowings Data
2008 2007 2006
(In thousands)
Federal funds purchased and securities sold under agreements to
repurchase:
Balance at year end ..................................... $ 3,142,493 $8,820,235 $7,676,254
Average outstanding
(based on average daily balances) ........................ 7,697,505 8,080,179 5,162,196
Maximum amount outstanding at any month-end ............. 10,879,818 9,984,206 7,676,254
Weighted-average interest rate at year end ................... 0.5% 3.3% 4.6%
Weighted-average interest rate on amounts outstanding during the
year (based on average daily balances) .................... 2.2% 4.7% 4.5%
Term Auction Facility:
Balance at year end ..................................... $10,000,000 $ — $ —
Average outstanding
(based on average daily balances) ........................ 5,924,639 — —
Maximum amount outstanding at any month-end ............. 13,000,000 — —
Weighted-average interest rate at year end ................... 1.1% — % — %
Weighted-average interest rate on amounts outstanding during the
year (based on average daily balances) .................... 2.0% — % — %
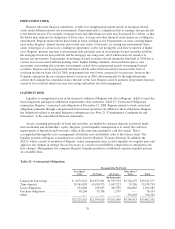
LONG-TERM BORROWINGS
Regions’ long-term borrowings consist primarily of FHLB borrowings, subordinated notes, senior notes and
other long-term notes payable. Total long-term debt increased $7.9 billion to $19.2 billion at December 31, 2008.
See Note 14 “Long-Term Borrowings” to the consolidated financial statements for further discussion.
Membership in the FHLB system provides access to a source of lower-cost funds. Long-term FHLB
advances totaled $8.1 billion at December 31, 2008, an increase of $4.3 billion compared to 2007.
In October 2008, the FDIC announced its TLGP to strengthen confidence and encourage liquidity in the
banking system by guaranteeing newly issued senior unsecured debt of banks, thrifts, and certain holding
companies, and by providing full coverage of non-interest bearing deposit transaction accounts, regardless of
dollar amount. Under the final rules, certain newly issued senior unsecured debt with maturities greater than 30
days issued on or before June 30, 2009, would be backed by the “full faith and credit” of the U.S. government
through June 30, 2012. The FDIC’s payment obligation under the guarantee for eligible senior unsecured debt
will be triggered by a payment default. The guarantee is limited to 125% of senior unsecured debt as of
September 30, 2008 that is scheduled to mature before June 30, 2009. This includes federal funds purchased,
promissory notes, commercial paper, and certain types of inter-bank funding. Participants will be charged a
50-100 basis point fee to protect their new debt issues which varies depending on the maturity date (amounts paid
as a non-refundable fee will be applied to offset the guaranteed fee until the non-refundable fee is exhausted).
Regions issued $3.75 billion of qualifying senior debt securities covered by the TLGP in December 2008, and
has remaining capacity under the program to issue up to an additional $4 billion.
Long-term borrowings also increased in 2008 as a result of the Company’s issuance of $750 million of
subordinated notes and $345 million of trust preferred securities. The increase from these issuances was partially
offset by the redemption of approximately $630 million in subordinated notes in 2008, resulting in a $65.4
million loss on early extinguishment of debt (see Table 8 “Non-Interest Expense (Including Non-GAAP
Reconciliation)”), and the maturity of approximately $750 million of senior debt notes during the year. As of
December 31, 2008, Regions had outstanding subordinated notes totaling $4.4 billion compared to $4.3 billion at
December 31, 2007. Regions’ subordinated notes consist of 11 issues with interest rates ranging from 4.85
61