Regions Bank 2008 Annual Report Download - page 57
Download and view the complete annual report
Please find page 57 of the 2008 Regions Bank annual report below. You can navigate through the pages in the report by either clicking on the pages listed below, or by using the keyword search tool below to find specific information within the annual report.-
 1
1 -
2
-
3
-
4
-
5
-
6
-
7
-
8
-
9
-
10
-
11
-
12
-
13
-
14
-
15
-
16
-
17
-
18
-
19
-
20
-
21
-
22
-
23
-
24
-
25
-
26
-
27
-
28
-
29
-
30
-
31
-
32
-
33
-
34
-
35
-
36
-
37
-
38
-
39
-
40
-
41
-
42
-
43
-
44
-
45
-
46
-
 47
47 -
 48
48 -
 49
49 -
 50
50 -
 51
51 -
 52
52 -
 53
53 -
 54
54 -
 55
55 -
 56
56 -
 57
57 -
 58
58 -
 59
59 -
 60
60 -
 61
61 -
 62
62 -
 63
63 -
 64
64 -
 65
65 -
 66
66 -
 67
67 -
68
-
69
-
70
-
71
-
72
-
73
-
74
-
75
-
76
-
77
-
78
-
79
-
80
-
81
-
82
-
83
-
84
-
85
-
86
-
87
-
88
-
89
-
90
-
91
-
92
-
93
-
94
-
95
-
96
-
97
-
98
-
99
-
100
-
101
-
102
-
103
-
104
-
105
-
106
-
107
-
108
-
109
-
110
-
111
-
112
-
113
-
114
-
115
-
116
-
117
-
118
-
119
-
120
-
121
-
122
-
123
-
124
-
125
-
126
-
127
-
128
-
129
-
130
-
131
-
132
-
133
-
134
-
135
-
136
-
137
-
138
-
139
-
140
-
141
-
142
-
143
-
144
-
145
-
146
-
147
-
148
-
149
-
150
-
151
-
152
-
153
-
154
-
155
-
156
-
157
-
158
-
159
-
160
-
161
-
162
-
163
-
164
-
165
-
166
-
167
-
168
-
169
-
170
-
171
-
172
-
173
-
174
-
175
-
176
-
177
-
178
-
179
-
180
-
181
-
182
-
183
-
184
 |
 |

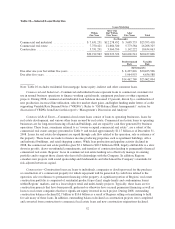
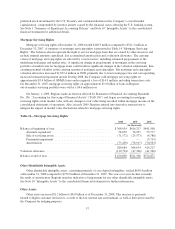
Table 8—Non-Interest Expense (including Non-GAAP reconciliation)
As Reported (GAAP)
2008 2007 2006
(In thousands)
Salaries and employee benefits ..................... $ 2,355,939 $2,471,869 $1,859,851
Net occupancy expense ........................... 442,145 413,711 254,628
Furniture and equipment expense ................... 334,541 301,330 157,897
Professional fees ................................ 214,191 151,991 97,220
Amortization of core deposit intangibles ............. 134,139 155,346 63,523
Other real estate owned expense .................... 102,766 15,862 2,206
Marketing ..................................... 96,916 134,050 70,198
Goodwill impairment ............................ 6,000,000 — —
Mortgage servicing rights impairment ............... 85,000 6,000 16,000
Other miscellaneous expenses ...................... 1,025,977 1,010,192 682,505
$10,791,614 $4,660,351 $3,204,028
Merger-Related Charges and Goodwill
Impairment
2008 2007 2006
(In thousands)
Salaries and employee benefits ..................... $ 133,401 $ 158,613 $ 65,693
Net occupancy expense ........................... 3,331 33,834 3,473
Furniture and equipment expense ................... 4,985 4,856 427
Professional fees ................................ 7,409 34,573 6,083
Amortization of core deposit intangibles .............———
Other real estate owned expense ....................———
Marketing ..................................... 12,692 42,897 1,092
Goodwill impairment ............................ 6,000,000 — —
Mortgage servicing rights impairment ...............———
Other miscellaneous expenses ...................... 38,353 76,094 11,891
$ 6,200,171 $ 350,867 $ 88,659
As Adjusted (Non-GAAP)
2008 2007 2006
(In thousands)
Salaries and employee benefits ..................... $ 2,222,538 $2,313,256 $1,794,158
Net occupancy expense ........................... 438,814 379,877 251,155
Furniture and equipment expense ................... 329,556 296,474 157,470
Professional fees ................................ 206,782 117,418 91,137
Amortization of core deposit intangibles ............. 134,139 155,346 63,523
Other real estate owned expense .................... 102,766 15,862 2,206
Marketing ..................................... 84,224 91,153 69,106
Mortgage servicing rights impairment ............... 85,000 6,000 16,000
Other miscellaneous expenses ...................... 987,624 934,098 670,614
$ 4,591,443 $4,309,484 $3,115,369
47