Regions Bank 2008 Annual Report Download - page 104
Download and view the complete annual report
Please find page 104 of the 2008 Regions Bank annual report below. You can navigate through the pages in the report by either clicking on the pages listed below, or by using the keyword search tool below to find specific information within the annual report.-
 1
1 -
2
-
3
-
4
-
5
-
6
-
7
-
8
-
9
-
10
-
11
-
12
-
13
-
14
-
15
-
16
-
17
-
18
-
19
-
20
-
21
-
22
-
23
-
24
-
25
-
26
-
27
-
28
-
29
-
30
-
31
-
32
-
33
-
34
-
35
-
36
-
37
-
38
-
39
-
40
-
41
-
42
-
43
-
44
-
45
-
46
-
47
-
48
-
49
-
50
-
51
-
52
-
53
-
54
-
55
-
56
-
57
-
58
-
59
-
60
-
61
-
62
-
63
-
64
-
65
-
66
-
67
-
68
-
69
-
70
-
71
-
72
-
73
-
74
-
75
-
76
-
77
-
78
-
79
-
80
-
81
-
82
-
83
-
84
-
85
-
86
-
87
-
88
-
89
-
90
-
91
-
92
-
93
-
 94
94 -
 95
95 -
 96
96 -
 97
97 -
 98
98 -
 99
99 -
 100
100 -
 101
101 -
 102
102 -
 103
103 -
 104
104 -
 105
105 -
 106
106 -
 107
107 -
 108
108 -
 109
109 -
 110
110 -
 111
111 -
 112
112 -
 113
113 -
 114
114 -
115
-
116
-
117
-
118
-
119
-
120
-
121
-
122
-
123
-
124
-
125
-
126
-
127
-
128
-
129
-
130
-
131
-
132
-
133
-
134
-
135
-
136
-
137
-
138
-
139
-
140
-
141
-
142
-
143
-
144
-
145
-
146
-
147
-
148
-
149
-
150
-
151
-
152
-
153
-
154
-
155
-
156
-
157
-
158
-
159
-
160
-
161
-
162
-
163
-
164
-
165
-
166
-
167
-
168
-
169
-
170
-
171
-
172
-
173
-
174
-
175
-
176
-
177
-
178
-
179
-
180
-
181
-
182
-
183
-
184
 |
 |

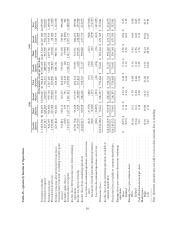
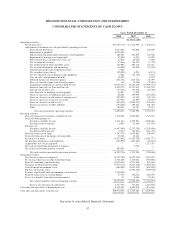
REGIONS FINANCIAL CORPORATION AND SUBSIDIARIES
CONSOLIDATED STATEMENTS OF OPERATIONS
Years Ended December 31
2008 2007 2006
(In thousands, except per share data)
Interest income on:
Loans, including fees ......................................................... $ 5,549,871 $6,924,544 $4,792,906
Securities:
Taxable ................................................................ 827,622 856,043 606,665
Tax-exempt ............................................................ 40,096 41,260 33,679
Total securities ...................................................... 867,718 897,303 640,344
Loans held for sale ........................................................... 35,733 92,097 69,444
Federal funds sold and securities purchased under agreements to resell .................. 18,623 50,801 45,650
Trading account assets ........................................................ 62,403 71,418 60,333
Other interest-earning assets ................................................... 29,042 38,500 40,441
Total interest income ..................................................... 6,563,390 8,074,663 5,649,118
Interest expense on:
Deposits ................................................................... 1,724,070 2,663,883 1,680,167
Short-term borrowings ........................................................ 369,388 459,467 275,497
Long-term borrowings ........................................................ 626,976 552,947 385,152
Total interest expense .................................................... 2,720,434 3,676,297 2,340,816
Net interest income ...................................................... 3,842,956 4,398,366 3,308,302
Provision for loan losses .......................................................... 2,057,000 555,000 142,373
Net interest income after provision for loan losses .................................. 1,785,956 3,843,366 3,165,929
Non-interest income:
Service charges on deposit accounts ............................................. 1,147,959 1,162,740 721,998
Brokerage, investment banking and capital markets ................................. 1,027,468 894,621 716,983
Trust department income ...................................................... 233,522 251,319 158,161
Mortgage income ............................................................ 137,676 135,704 178,688
Securities gains (losses), net ................................................... 92,495 (8,553) 8,123
Other ..................................................................... 434,111 420,004 245,767
Total non-interest income ................................................. 3,073,231 2,855,835 2,029,720
Non-interest expense:
Salaries and employee benefits ................................................. 2,355,939 2,471,869 1,859,851
Net occupancy expense ....................................................... 442,145 413,711 254,628
Furniture and equipment expense ............................................... 334,541 301,330 157,897
Goodwill impairment ......................................................... 6,000,000 — —
Other ..................................................................... 1,658,989 1,473,441 931,652
Total non-interest expense ................................................. 10,791,614 4,660,351 3,204,028
Income (loss) before income taxes from continuing operations ............................ (5,932,427) 2,038,850 1,991,621
Income tax expense (benefit) ....................................................... (348,114) 645,687 619,100
Income (loss) from continuing operations ......................................... (5,584,313) 1,393,163 1,372,521
Discontinued operations (Note 4):
Loss from discontinued operations before income taxes .............................. (18,405) (217,387) (32,606)
Income tax benefit ........................................................... (6,944) (75,319) (13,230)
Loss from discontinued operations .................................................. (11,461) (142,068) (19,376)
Net income (loss) ............................................................ $(5,595,774) $1,251,095 $1,353,145
Income (loss) from continuing operations available to common shareholders ............. $(5,610,549) $1,393,163 $1,372,521
Net income (loss) available to common shareholders ................................ $(5,622,010) $1,251,095 $1,353,145
Weighted-average number of common shares outstanding:
Basic ...................................................................... 695,003 707,981 501,681
Diluted .................................................................... 695,003 712,743 506,989
Earnings (loss) per common share from continuing operations:
Basic ...................................................................... $ (8.07) $ 1.97 $ 2.74
Diluted .................................................................... (8.07) 1.95 2.71
Earnings (loss) per common share:
Basic ...................................................................... (8.09) 1.77 2.70
Diluted .................................................................... (8.09) 1.76 2.67
Cash dividends declared per common share ........................................... 0.96 1.46 1.40
See notes to consolidated financial statements.
94