Regions Bank 2008 Annual Report Download - page 138
Download and view the complete annual report
Please find page 138 of the 2008 Regions Bank annual report below. You can navigate through the pages in the report by either clicking on the pages listed below, or by using the keyword search tool below to find specific information within the annual report.-
 1
1 -
2
-
3
-
4
-
5
-
6
-
7
-
8
-
9
-
10
-
11
-
12
-
13
-
14
-
15
-
16
-
17
-
18
-
19
-
20
-
21
-
22
-
23
-
24
-
25
-
26
-
27
-
28
-
29
-
30
-
31
-
32
-
33
-
34
-
35
-
36
-
37
-
38
-
39
-
40
-
41
-
42
-
43
-
44
-
45
-
46
-
47
-
48
-
49
-
50
-
51
-
52
-
53
-
54
-
55
-
56
-
57
-
58
-
59
-
60
-
61
-
62
-
63
-
64
-
65
-
66
-
67
-
68
-
69
-
70
-
71
-
72
-
73
-
74
-
75
-
76
-
77
-
78
-
79
-
80
-
81
-
82
-
83
-
84
-
85
-
86
-
87
-
88
-
89
-
90
-
91
-
92
-
93
-
94
-
95
-
96
-
97
-
98
-
99
-
100
-
101
-
102
-
103
-
104
-
105
-
106
-
107
-
108
-
109
-
110
-
111
-
112
-
113
-
114
-
115
-
116
-
117
-
118
-
119
-
120
-
121
-
122
-
123
-
124
-
125
-
126
-
127
-
 128
128 -
 129
129 -
 130
130 -
 131
131 -
 132
132 -
 133
133 -
 134
134 -
 135
135 -
 136
136 -
 137
137 -
 138
138 -
 139
139 -
 140
140 -
 141
141 -
 142
142 -
 143
143 -
 144
144 -
 145
145 -
 146
146 -
 147
147 -
 148
148 -
149
-
150
-
151
-
152
-
153
-
154
-
155
-
156
-
157
-
158
-
159
-
160
-
161
-
162
-
163
-
164
-
165
-
166
-
167
-
168
-
169
-
170
-
171
-
172
-
173
-
174
-
175
-
176
-
177
-
178
-
179
-
180
-
181
-
182
-
183
-
184
 |
 |

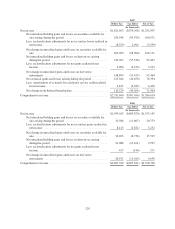
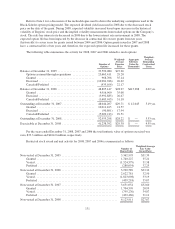
2007
Before Tax Tax Effect Net of Tax
(In thousands)
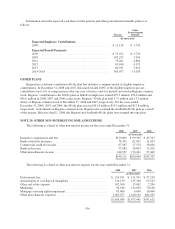
Net income ................................................. $1,821,463 $(570,368) $1,251,095
Net unrealized holding gains and losses on securities available for
sale arising during the period ............................. 256,546 (95,974) 160,572
Less: reclassification adjustments for net securities losses realized in
net income ............................................ (8,553) 2,994 (5,559)
Net change in unrealized gains and losses on securities available for
sale ................................................. 265,099 (98,968) 166,131
Net unrealized holding gains and losses on derivatives arising
during the period ....................................... 154,965 (55,558) 99,407
Less: reclassification adjustments for net gains realized in net
income ............................................... 6,066 (2,123) 3,943
Net change in unrealized gains and losses on derivative
instruments ........................................... 148,899 (53,435) 95,464
Net actuarial gains and losses arising during the period ........... 123,044 (46,650) 76,394
Less: amortization of actuarial loss and prior service credit realized
in net income .......................................... 6,815 (2,385) 4,430
Net change from defined benefit plans ........................ 116,229 (44,265) 71,964
Comprehensive income ........................................ $2,351,690 $(767,036) $1,584,654
2006
Before Tax Tax Effect Net of Tax
(In thousands)
Net income ................................................. $1,959,015 $(605,870) $1,353,145
Net unrealized holding gains and losses on securities available for
sale arising during the period ............................. 32,386 (11,607) 20,779
Less: reclassification adjustments for net securities gains realized in
net income ............................................ 8,123 (2,871) 5,252
Net change in unrealized gains and losses on securities available for
sale ................................................. 24,263 (8,736) 15,527
Net unrealized holding gains and losses on derivatives arising
during the period ....................................... 21,088 (11,161) 9,927
Less: reclassification adjustments for net gains realized in net
income ............................................... 417 (146) 271
Net change in unrealized gains and losses on derivative
instruments ........................................... 20,671 (11,015) 9,656
Comprehensive income ........................................ $2,003,949 $(625,621) $1,378,328
128