Regions Bank 2008 Annual Report Download - page 106
Download and view the complete annual report
Please find page 106 of the 2008 Regions Bank annual report below. You can navigate through the pages in the report by either clicking on the pages listed below, or by using the keyword search tool below to find specific information within the annual report.-
 1
1 -
2
-
3
-
4
-
5
-
6
-
7
-
8
-
9
-
10
-
11
-
12
-
13
-
14
-
15
-
16
-
17
-
18
-
19
-
20
-
21
-
22
-
23
-
24
-
25
-
26
-
27
-
28
-
29
-
30
-
31
-
32
-
33
-
34
-
35
-
36
-
37
-
38
-
39
-
40
-
41
-
42
-
43
-
44
-
45
-
46
-
47
-
48
-
49
-
50
-
51
-
52
-
53
-
54
-
55
-
56
-
57
-
58
-
59
-
60
-
61
-
62
-
63
-
64
-
65
-
66
-
67
-
68
-
69
-
70
-
71
-
72
-
73
-
74
-
75
-
76
-
77
-
78
-
79
-
80
-
81
-
82
-
83
-
84
-
85
-
86
-
87
-
88
-
89
-
90
-
91
-
92
-
93
-
94
-
95
-
 96
96 -
 97
97 -
 98
98 -
 99
99 -
 100
100 -
 101
101 -
 102
102 -
 103
103 -
 104
104 -
 105
105 -
 106
106 -
 107
107 -
 108
108 -
 109
109 -
 110
110 -
 111
111 -
 112
112 -
 113
113 -
 114
114 -
 115
115 -
 116
116 -
117
-
118
-
119
-
120
-
121
-
122
-
123
-
124
-
125
-
126
-
127
-
128
-
129
-
130
-
131
-
132
-
133
-
134
-
135
-
136
-
137
-
138
-
139
-
140
-
141
-
142
-
143
-
144
-
145
-
146
-
147
-
148
-
149
-
150
-
151
-
152
-
153
-
154
-
155
-
156
-
157
-
158
-
159
-
160
-
161
-
162
-
163
-
164
-
165
-
166
-
167
-
168
-
169
-
170
-
171
-
172
-
173
-
174
-
175
-
176
-
177
-
178
-
179
-
180
-
181
-
182
-
183
-
184
 |
 |

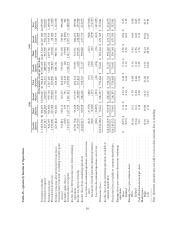
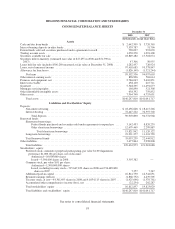
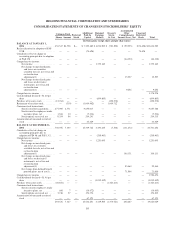
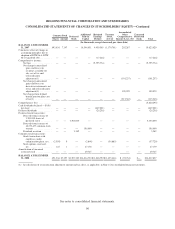
REGIONS FINANCIAL CORPORATION AND SUBSIDIARIES
CONSOLIDATED STATEMENTS OF CHANGES IN STOCKHOLDERS’ EQUITY—Continued
Common Stock Preferred
Stock
Additional
Paid-In
Capital
Retained
Earnings
(Deficit)
Treasury
Stock,
At Cost
Accumulated
Other
Comprehensive
Income (Loss), Net
Unearned
Restricted
Stock TotalShares Amount
(In thousands, except share and per share data)
BALANCE AT DECEMBER
31, 2007 ..................693,636 7,347 — 16,544,651 4,439,505 (1,370,761) 202,287 — 19,823,029
Cumulative effect of change in
accounting principles due to
adoption of EITF 06-4, EITF
06-10 and FAS 158 .......... — — — — (17,246) — — — (17,246)
Comprehensive income:
Net loss ................. — — — — (5,595,774) — — — (5,595,774)
Net change in unrealized
gains and losses on
securities available for
sale, net of tax and
reclassification
adjustment(1) .......... — — — — — — (101,237) — (101,237)
Net change in unrealized
gains and losses on
derivative instruments, net
of tax and reclassification
adjustment(1) .......... — — — — — — 190,079 — 190,079
Net change from defined
benefit pension plans, net
of tax(1) .............. — — — — — — (313,363) — (313,363)
Comprehensive loss ........... (5,820,295)
Cash dividends declared — $0.96
per share .................. — — — — (669,001) — — — (669,001)
Preferred dividends ............ — — — — (26,236) — — — (26,236)
Preferred stock transactions:
Proceeds from issuance of
3,500,000 shares of
preferred stock ......... — — 3,304,000 — — — — — 3,304,000
Proceeds from issuance of
48,253,677 common stock
warrant ............... — — — 196,000 — — — — 196,000
Dividend accretion ........ — — 3,382 — — — — — 3,382
Common stock transactions:
Stock transactions with
employees under
compensation plans, net . . (2,395) 9 — (2,844) — (54,885) — — (57,720)
Stock options exercised,
net ................... 125 1 — 27,178 — — — — 27,179
Amortization of unearned
restricted stock ............. — — — 49,745 — — — — 49,745
BALANCE AT DECEMBER
31, 2008 ..................691,366 $7,357 $3,307,382 $16,814,730 $(1,868,752)$(1,425,646) $ (22,234) $— $16,812,837
(1) See disclosure of reclassification adjustment amount and tax effect, as applicable, in Note 16 to consolidated financial statements.
See notes to consolidated financial statements.
96