Regions Bank 2008 Annual Report Download - page 66
Download and view the complete annual report
Please find page 66 of the 2008 Regions Bank annual report below. You can navigate through the pages in the report by either clicking on the pages listed below, or by using the keyword search tool below to find specific information within the annual report.-
 1
1 -
2
-
3
-
4
-
5
-
6
-
7
-
8
-
9
-
10
-
11
-
12
-
13
-
14
-
15
-
16
-
17
-
18
-
19
-
20
-
21
-
22
-
23
-
24
-
25
-
26
-
27
-
28
-
29
-
30
-
31
-
32
-
33
-
34
-
35
-
36
-
37
-
38
-
39
-
40
-
41
-
42
-
43
-
44
-
45
-
46
-
47
-
48
-
49
-
50
-
51
-
52
-
53
-
54
-
55
-
 56
56 -
 57
57 -
 58
58 -
 59
59 -
 60
60 -
 61
61 -
 62
62 -
 63
63 -
 64
64 -
 65
65 -
 66
66 -
 67
67 -
 68
68 -
 69
69 -
 70
70 -
 71
71 -
 72
72 -
 73
73 -
 74
74 -
 75
75 -
 76
76 -
77
-
78
-
79
-
80
-
81
-
82
-
83
-
84
-
85
-
86
-
87
-
88
-
89
-
90
-
91
-
92
-
93
-
94
-
95
-
96
-
97
-
98
-
99
-
100
-
101
-
102
-
103
-
104
-
105
-
106
-
107
-
108
-
109
-
110
-
111
-
112
-
113
-
114
-
115
-
116
-
117
-
118
-
119
-
120
-
121
-
122
-
123
-
124
-
125
-
126
-
127
-
128
-
129
-
130
-
131
-
132
-
133
-
134
-
135
-
136
-
137
-
138
-
139
-
140
-
141
-
142
-
143
-
144
-
145
-
146
-
147
-
148
-
149
-
150
-
151
-
152
-
153
-
154
-
155
-
156
-
157
-
158
-
159
-
160
-
161
-
162
-
163
-
164
-
165
-
166
-
167
-
168
-
169
-
170
-
171
-
172
-
173
-
174
-
175
-
176
-
177
-
178
-
179
-
180
-
181
-
182
-
183
-
184
 |
 |

government sponsored agencies, both on a direct and indirect basis, represented approximately 98.5 percent of
the investment portfolio at December 31, 2008. State, county, and local municipal securities rated below single A
or which are non-rated represented only 1.5 percent of total securities at year-end 2008.
Cash and Cash Equivalents
Cash and cash equivalents include cash and cash due from banks, interest-bearing deposits in other banks
(including the Federal Reserve Bank), and federal funds sold and securities purchased under agreements to resell
(which have a life of 90 days or less). At December 31, 2008 these assets totaled $11.0 billion as compared to
$4.7 billion at December 31, 2007. The year-over-year increase was primarily driven by Regions’ participation in
the Term Auction Facility (“TAF”) auctions, which have provided excess balances in its Federal Reserve Bank
account. The excess balances are held to provide additional insulation from unforeseen contingent funding needs.
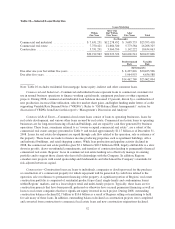
Trading Account Assets
Trading account assets decreased $41.1 million to $1.1 billion at December 31, 2008. Trading account
assets, which consist of U.S. Government agency and guaranteed securities and corporate and tax-exempt
securities, are primarily held at Morgan Keegan for the purpose of selling at a profit. Also included in trading
account assets are securities held in rabbi trusts related to deferred compensation plans. Trading account assets
are carried at market value with changes in market value reflected in the consolidated statements of operations.
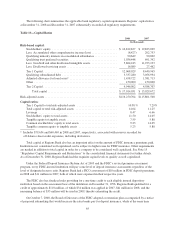
Table 13 “Trading Account Assets” provides a detail by type of security.
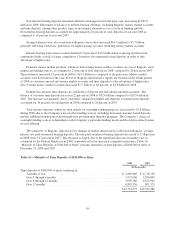
Table 13—Trading Account Assets
December 31
2008 2007
(In thousands)
Trading account assets:
U.S. Treasury and Federal agency securities ........... $ 510,226 $ 440,267
Obligations of states and political subdivisions ......... 308,271 236,997
Other securities .................................. 231,773 414,136
$1,050,270 $1,091,400
Premises and Equipment
Premises and equipment are stated at cost, less accumulated depreciation and amortization, as applicable.
Premises and equipment at December 31, 2008 increased $175.2 million to $2.8 billion compared to year-end
2007. This increase primarily resulted from the continued investment in capital additions, including the opening
of 20 new branches during 2008.
Goodwill
Goodwill at December 31, 2008 totaled $5.5 billion as compared to $11.5 billion at December 31, 2007. The
decrease was driven by a $6.0 billion fourth quarter 2008 non-cash impairment charge to the asset carrying value.
The impairment testing is performed on each of the Company’s reportable units on an annual basis, or more often
if events or circumstances indicate that there may be impairment. As of December 31, 2008, Regions’ analysis
indicated impairment for the General Banking/Treasury reporting unit’s goodwill, therefore resulting in the
goodwill impairment charge. The primary cause of the goodwill impairment in the General Banking/Treasury
reporting unit was the continued and significant decline in the estimated fair value of the unit. This was
evidenced by rapid deterioration in credit costs, continued compression of the net interest margin, cost of
56