Regions Bank 2008 Annual Report Download - page 47
Download and view the complete annual report
Please find page 47 of the 2008 Regions Bank annual report below. You can navigate through the pages in the report by either clicking on the pages listed below, or by using the keyword search tool below to find specific information within the annual report.-
 1
1 -
2
-
3
-
4
-
5
-
6
-
7
-
8
-
9
-
10
-
11
-
12
-
13
-
14
-
15
-
16
-
17
-
18
-
19
-
20
-
21
-
22
-
23
-
24
-
25
-
26
-
27
-
28
-
29
-
30
-
31
-
32
-
33
-
34
-
35
-
36
-
 37
37 -
 38
38 -
 39
39 -
 40
40 -
 41
41 -
 42
42 -
 43
43 -
 44
44 -
 45
45 -
 46
46 -
 47
47 -
 48
48 -
 49
49 -
 50
50 -
 51
51 -
 52
52 -
 53
53 -
 54
54 -
 55
55 -
 56
56 -
 57
57 -
58
-
59
-
60
-
61
-
62
-
63
-
64
-
65
-
66
-
67
-
68
-
69
-
70
-
71
-
72
-
73
-
74
-
75
-
76
-
77
-
78
-
79
-
80
-
81
-
82
-
83
-
84
-
85
-
86
-
87
-
88
-
89
-
90
-
91
-
92
-
93
-
94
-
95
-
96
-
97
-
98
-
99
-
100
-
101
-
102
-
103
-
104
-
105
-
106
-
107
-
108
-
109
-
110
-
111
-
112
-
113
-
114
-
115
-
116
-
117
-
118
-
119
-
120
-
121
-
122
-
123
-
124
-
125
-
126
-
127
-
128
-
129
-
130
-
131
-
132
-
133
-
134
-
135
-
136
-
137
-
138
-
139
-
140
-
141
-
142
-
143
-
144
-
145
-
146
-
147
-
148
-
149
-
150
-
151
-
152
-
153
-
154
-
155
-
156
-
157
-
158
-
159
-
160
-
161
-
162
-
163
-
164
-
165
-
166
-
167
-
168
-
169
-
170
-
171
-
172
-
173
-
174
-
175
-
176
-
177
-
178
-
179
-
180
-
181
-
182
-
183
-
184
 |
 |
approximately 9.5 percent ($11.3 million) and 16.8 percent ($20.1 million), respectively. Conversely, 25 basis
point and 50 basis point increases in these rates would increase the December 31, 2008 fair value of MSRs by
approximately 10.1 percent ($12.0 million) and 23.0 percent ($27.5 million), respectively.
The pro forma fair value analysis presented above demonstrates the sensitivity of fair values to hypothetical
changes in primary mortgage rates. This sensitivity analysis does not reflect an expected outcome. Refer to
“Mortgage Servicing Rights” discussion in the “Balance Sheet” analysis.
Income Taxes
Accrued taxes represent the estimated amount payable to or receivable from taxing jurisdictions, either
currently or in the future, and are reported, on a net basis, as a component of “other assets” in the consolidated
balance sheets. The calculation of Regions’ income tax expense is complex and requires the use of many
estimates and judgments in its determination.
Management’s determination of the realization of the net deferred tax asset is based upon management’s
judgment of various future events and uncertainties, including the timing and amount of future income earned by
certain subsidiaries and the implementation of various tax plans to maximize realization of the deferred tax asset.
Management believes that the subsidiaries will generate sufficient operating earnings to realize the deferred tax
benefits.
From time to time, for certain business plans enacted by Regions, management bases the estimates of related
tax liabilities on its belief that future events will validate management’s current assumptions regarding the
ultimate outcome of tax-related exposures. While Regions has obtained the opinion of advisors that the
anticipated tax treatment of these transactions should prevail and has assessed the relative merits and risks of the
appropriate tax treatment, examination of Regions’ income tax returns, changes in tax law and regulatory
guidance may impact the tax treatment of these transactions and resulting provisions for income taxes.
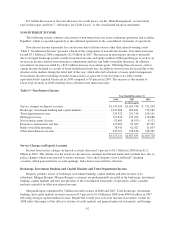
OPERATING RESULTS
GENERAL
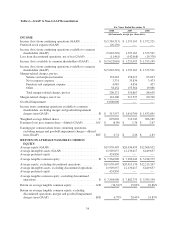
Regions reported a net loss available to common shareholders of $5.6 billion in 2008, compared to net
income of $1.3 billion in 2007. Results in 2008 were significantly impacted by a $6.0 billion non-cash goodwill
impairment charge recorded in the fourth quarter of 2008. After-tax merger-related expenses of approximately
$124.1 million and $217.5 million were incurred during 2008 and 2007, respectively. Excluding the impact of
merger-related charges and goodwill impairment, earnings from continuing operations were $513.6 million in
2008 compared to $1.6 billion in 2007. Refer to Table 2 “GAAP to Non-GAAP Reconciliation” for additional
details.
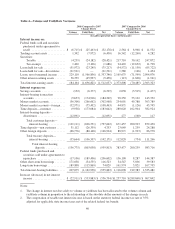
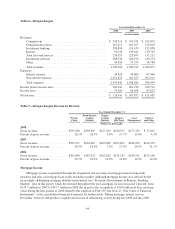
NET INTEREST INCOME AND MARGIN
Net interest income (interest income less interest expense) is Regions’ principal source of income and is one
of the most important elements of Regions’ ability to meet its overall performance goals. Net interest income on
a taxable-equivalent basis decreased 13 percent to $3.9 billion in 2008 from $4.4 billion in 2007, resulting in a
decline in the net interest margin, which declined from 3.79 percent in 2007 to 3.23 percent in 2008. The net
interest margin was impacted substantially by developments in the aforementioned economic and operating
environment in 2008. More specifically, changes in market interest rates and the yield curve were closely
connected with economic developments during the year. Regions’ balance sheet was in an asset sensitive position
during 2008, meaning that decreases in interest rates cause contraction in the Company’s net interest margin. As
such, falling rates in 2008 led to an unfavorable change in the yield curve and, in turn, the net interest margin.
However, changes in the level and shape of the yield curve were largely symptomatic of the pervasive
disturbances in the financial markets and the broader economy, observed particularly during the second half of
37