Regions Bank 2008 Annual Report Download - page 113
Download and view the complete annual report
Please find page 113 of the 2008 Regions Bank annual report below. You can navigate through the pages in the report by either clicking on the pages listed below, or by using the keyword search tool below to find specific information within the annual report.-
 1
1 -
2
-
3
-
4
-
5
-
6
-
7
-
8
-
9
-
10
-
11
-
12
-
13
-
14
-
15
-
16
-
17
-
18
-
19
-
20
-
21
-
22
-
23
-
24
-
25
-
26
-
27
-
28
-
29
-
30
-
31
-
32
-
33
-
34
-
35
-
36
-
37
-
38
-
39
-
40
-
41
-
42
-
43
-
44
-
45
-
46
-
47
-
48
-
49
-
50
-
51
-
52
-
53
-
54
-
55
-
56
-
57
-
58
-
59
-
60
-
61
-
62
-
63
-
64
-
65
-
66
-
67
-
68
-
69
-
70
-
71
-
72
-
73
-
74
-
75
-
76
-
77
-
78
-
79
-
80
-
81
-
82
-
83
-
84
-
85
-
86
-
87
-
88
-
89
-
90
-
91
-
92
-
93
-
94
-
95
-
96
-
97
-
98
-
99
-
100
-
101
-
102
-
 103
103 -
 104
104 -
 105
105 -
 106
106 -
 107
107 -
 108
108 -
 109
109 -
 110
110 -
 111
111 -
 112
112 -
 113
113 -
 114
114 -
 115
115 -
 116
116 -
 117
117 -
 118
118 -
 119
119 -
 120
120 -
 121
121 -
 122
122 -
 123
123 -
124
-
125
-
126
-
127
-
128
-
129
-
130
-
131
-
132
-
133
-
134
-
135
-
136
-
137
-
138
-
139
-
140
-
141
-
142
-
143
-
144
-
145
-
146
-
147
-
148
-
149
-
150
-
151
-
152
-
153
-
154
-
155
-
156
-
157
-
158
-
159
-
160
-
161
-
162
-
163
-
164
-
165
-
166
-
167
-
168
-
169
-
170
-
171
-
172
-
173
-
174
-
175
-
176
-
177
-
178
-
179
-
180
-
181
-
182
-
183
-
184
 |
 |

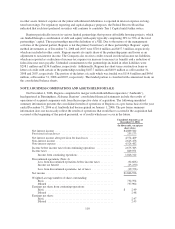
The Company’s goodwill is tested for impairment on an annual basis, or more often if events or
circumstances indicate that there may be impairment. Adverse changes in the economic environment, declining
operations, or other factors could result in a decline in the implied fair value of goodwill. If the implied fair value
is less than the carrying amount, a loss would be recognized in other non-interest expense to reduce the carrying
amount to implied fair value of goodwill. A goodwill impairment test includes two steps. Step One, used to
identify potential impairment, compares the estimated fair value of a reporting unit with its carrying amount,
including goodwill. If the estimated fair value of a reporting unit exceeds its carrying amount, goodwill of the
reporting unit is considered not impaired. If the carrying amount of a reporting unit exceeds its estimated fair
value, the second step of the goodwill impairment test is performed to measure the amount of impairment loss, if
any. Step Two of the goodwill impairment test compares the implied estimated fair value of reporting unit
goodwill with the carrying amount of that goodwill. If the carrying amount of goodwill for that reporting unit
exceeds the implied fair value of that unit’s goodwill, an impairment loss is recognized in an amount equal to that
excess. Regions tested goodwill for impairment several times during 2008 and recorded a $6 billion impairment
charge within the General Bank/Treasury unit during the fourth quarter.
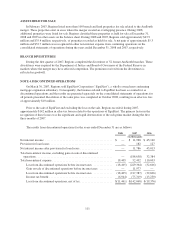
For purposes of testing goodwill for impairment, Regions uses both the income and market approaches to
value its reporting units. The income approach consists of discounting projected long-term future cash flows,
which are derived from internal forecasts and economic expectations for the respective reporting units. The
projected future cash flows are discounted using cost of capital metrics for Regions’ peer group or a build-up
approach (such as the capital asset pricing model) applicable to each reporting group. The significant inputs to
the income approach include the long-term target tangible equity to tangible assets ratio and the discount rate,
which is determined in the build-up approach using the risk-free rate of return, adjusted equity beta, equity risk
premium, and a company-specific risk factor. The company-specific risk factor is used to address the uncertainty
of growth estimates and earnings projections of management.
Regions uses the public company method and the transaction method as the two market approaches. The
public company method applies a value multiplier derived from each reporting unit’s peer group to a financial
metric of the reporting unit (e.g. last twelve months of net income, last twelve months of earnings before interest,
taxes and depreciation, tangible book value, etc.) and an implied control premium to the respective reporting unit.
The control premium is evaluated and compared to similar financial services transactions. The transaction
method applies a value multiplier to a financial metric of the reporting unit based on comparable observed
purchase transactions in the financial services industry for the reporting unit (where available).
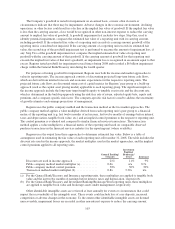
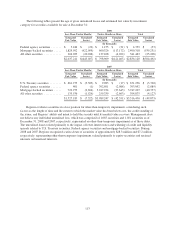
Regions uses the output from these approaches to determine estimated fair value. Below is a table of
assumptions used in estimating the fair value of each reporting unit at December 31, 2008. The table includes the
discount rate used in the income approach, the market multiplier used in the market approaches, and the implied
control premium applied to all reporting units.
General Banking/
Treasury
Investment
Banking/
Brokerage/
Trust Insurance
Discount rate used in income approach ................ 21% 11% 9%
Public company method market multiplier (a) ........... 0.6x n/a 8.7x
Public company method control premium .............. 30% 30% 30%
Transaction method market multiplier (b) .............. 0.8x 3.32x n/a
(a) For the General Bank/Treasury and Insurance reporting units, these multipliers are applied to tangible book
value and the last twelve months of earnings before interest, taxes and depreciation, respectively.
(b) For the General Bank/Treasury and Investment Banking/Brokerage/Trust reporting units, these multipliers
are applied to tangible book value and brokerage assets under management, respectively.
Other identifiable intangible assets are reviewed at least annually for events or circumstances that could
impact the recoverability of the intangible asset. These events could include loss of core deposits, increased
competition or adverse changes in the economy. To the extent other identifiable intangible assets are deemed
unrecoverable, impairment losses are recorded in other non-interest expense to reduce the carrying amount.
103