Regions Bank 2008 Annual Report Download - page 137
Download and view the complete annual report
Please find page 137 of the 2008 Regions Bank annual report below. You can navigate through the pages in the report by either clicking on the pages listed below, or by using the keyword search tool below to find specific information within the annual report.-
 1
1 -
2
-
3
-
4
-
5
-
6
-
7
-
8
-
9
-
10
-
11
-
12
-
13
-
14
-
15
-
16
-
17
-
18
-
19
-
20
-
21
-
22
-
23
-
24
-
25
-
26
-
27
-
28
-
29
-
30
-
31
-
32
-
33
-
34
-
35
-
36
-
37
-
38
-
39
-
40
-
41
-
42
-
43
-
44
-
45
-
46
-
47
-
48
-
49
-
50
-
51
-
52
-
53
-
54
-
55
-
56
-
57
-
58
-
59
-
60
-
61
-
62
-
63
-
64
-
65
-
66
-
67
-
68
-
69
-
70
-
71
-
72
-
73
-
74
-
75
-
76
-
77
-
78
-
79
-
80
-
81
-
82
-
83
-
84
-
85
-
86
-
87
-
88
-
89
-
90
-
91
-
92
-
93
-
94
-
95
-
96
-
97
-
98
-
99
-
100
-
101
-
102
-
103
-
104
-
105
-
106
-
107
-
108
-
109
-
110
-
111
-
112
-
113
-
114
-
115
-
116
-
117
-
118
-
119
-
120
-
121
-
122
-
123
-
124
-
125
-
126
-
 127
127 -
 128
128 -
 129
129 -
 130
130 -
 131
131 -
 132
132 -
 133
133 -
 134
134 -
 135
135 -
 136
136 -
 137
137 -
 138
138 -
 139
139 -
 140
140 -
 141
141 -
 142
142 -
 143
143 -
 144
144 -
 145
145 -
 146
146 -
 147
147 -
148
-
149
-
150
-
151
-
152
-
153
-
154
-
155
-
156
-
157
-
158
-
159
-
160
-
161
-
162
-
163
-
164
-
165
-
166
-
167
-
168
-
169
-
170
-
171
-
172
-
173
-
174
-
175
-
176
-
177
-
178
-
179
-
180
-
181
-
182
-
183
-
184
 |
 |

owns any of the Series A Preferred Stock. Regions stock maintained within trust or brokerage accounts related to
Company deferred compensation plans was recorded in treasury stock during 2008. During 2007, Regions
repurchased 40.8 million shares, respectively, at a cost of $1.4 billion. At December 31, 2008, there were
approximately 23.1 million shares remaining under this authorization.
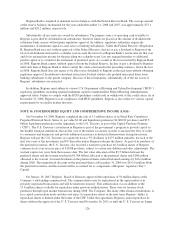
In April 2007, Regions entered into an agreement to repurchase approximately 14.2 million shares of its
outstanding common stock for an initial purchase price of $500 million. These shares were accounted for as
treasury stock on the date of purchase. Regions simultaneously entered into a forward contract indexed to these
same shares. In August 2007, Regions received approximately 781,000 shares upon settlement of the forward
contract.
At December 31, 2008, there were 53,288,000 shares reserved for issuance under stock compensation plans.
Stock options outstanding represent 52,955,000 shares and 333,000 shares are reserved for issuance under
deferred compensation plans.
In 2008, Regions decreased its dividend to $0.96 per common share, compared to $1.46 in 2007 and $1.40
in 2006. Also, the payment of dividends by Regions to its shareholders is limited to $0.10 per share per quarter
until November 14, 2011 or until the U. S. Treasury no longer owns any of Regions Series A Preferred Stock.
In 2006, Regions retired 31.0 million shares of treasury stock, with a cost of $1.1 billion. There were no
retirements of treasury stock during 2008 and 2007.
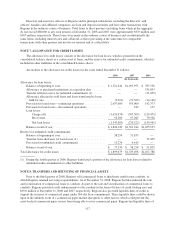
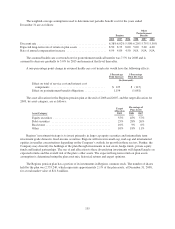
Comprehensive income (loss) is the total of net income (loss) and all other non-owner changes in equity.
Items that are to be recognized under accounting standards as components of comprehensive income (loss) are
displayed in the consolidated statements of changes in stockholders’ equity. In the calculation of comprehensive
income (loss), certain reclassification adjustments are made to avoid double-counting items that are displayed as
part of net income for a period that also had been displayed as part of other comprehensive income (loss) in that
period or earlier periods.
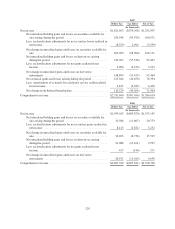
The disclosure of the reclassification amount for the years ended December 31 is as follows:
2008
Before Tax Tax Effect Net of Tax
(In thousands)
Net income (loss) ........................................... $(5,950,832) $ 355,058 $(5,595,774)
Net unrealized holding gains and losses on securities available for
sale arising during the period ............................ (70,440) 29,325 (41,115)
Less: reclassification adjustments for net securities gains realized
in net income (loss) ................................... 92,495 (32,373) 60,122
Net change in unrealized gains and losses on securities available
for sale ............................................. (162,935) 61,698 (101,237)
Net unrealized holding gains and losses on derivatives arising
during the period ..................................... 448,845 (170,696) 278,149
Less: reclassification adjustments for net gains realized in net
income (loss) ........................................ 142,138 (54,068) 88,070
Net change in unrealized gains and losses on derivative
instruments .......................................... 306,707 (116,628) 190,079
Net actuarial gains and losses arising during the period ......... (503,691) 192,171 (311,520)
Less: amortization of actuarial loss and prior service credit
realized in net income (loss) ............................ 2,836 (993) 1,843
Net change from defined benefit plans ...................... (506,527) 193,164 (313,363)
Comprehensive income (loss) ................................. $(6,313,587) $ 493,292 $(5,820,295)
127