Regions Bank 2008 Annual Report Download - page 80
Download and view the complete annual report
Please find page 80 of the 2008 Regions Bank annual report below. You can navigate through the pages in the report by either clicking on the pages listed below, or by using the keyword search tool below to find specific information within the annual report.-
 1
1 -
2
-
3
-
4
-
5
-
6
-
7
-
8
-
9
-
10
-
11
-
12
-
13
-
14
-
15
-
16
-
17
-
18
-
19
-
20
-
21
-
22
-
23
-
24
-
25
-
26
-
27
-
28
-
29
-
30
-
31
-
32
-
33
-
34
-
35
-
36
-
37
-
38
-
39
-
40
-
41
-
42
-
43
-
44
-
45
-
46
-
47
-
48
-
49
-
50
-
51
-
52
-
53
-
54
-
55
-
56
-
57
-
58
-
59
-
60
-
61
-
62
-
63
-
64
-
65
-
66
-
67
-
68
-
69
-
 70
70 -
 71
71 -
 72
72 -
 73
73 -
 74
74 -
 75
75 -
 76
76 -
 77
77 -
 78
78 -
 79
79 -
 80
80 -
 81
81 -
 82
82 -
 83
83 -
 84
84 -
 85
85 -
 86
86 -
 87
87 -
 88
88 -
 89
89 -
 90
90 -
91
-
92
-
93
-
94
-
95
-
96
-
97
-
98
-
99
-
100
-
101
-
102
-
103
-
104
-
105
-
106
-
107
-
108
-
109
-
110
-
111
-
112
-
113
-
114
-
115
-
116
-
117
-
118
-
119
-
120
-
121
-
122
-
123
-
124
-
125
-
126
-
127
-
128
-
129
-
130
-
131
-
132
-
133
-
134
-
135
-
136
-
137
-
138
-
139
-
140
-
141
-
142
-
143
-
144
-
145
-
146
-
147
-
148
-
149
-
150
-
151
-
152
-
153
-
154
-
155
-
156
-
157
-
158
-
159
-
160
-
161
-
162
-
163
-
164
-
165
-
166
-
167
-
168
-
169
-
170
-
171
-
172
-
173
-
174
-
175
-
176
-
177
-
178
-
179
-
180
-
181
-
182
-
183
-
184
 |
 |

PREPAYMENT RISK
Regions, like most financial institutions, is subject to changing prepayment speeds on mortgage-related
assets under different interest rate environments. Prepayment risk is a significant risk to earnings and specifically
to net interest income. For example, mortgage loans and other financial assets may be prepaid by a debtor, so that
the debtor may refinance its obligations at lower rates. As loans and other financial assets prepay in a falling rate
environment, Regions must reinvest these funds in lower-yielding assets. Prepayments of assets carrying higher
rates reduce Regions’ interest income and overall asset yields. Conversely, in a rising rate environment, these
assets will prepay at a slower rate, resulting in opportunity cost by not having the cash flow to reinvest at higher
rates. Regions’ greatest exposure to prepayment risks primarily rests in its mortgage-backed securities portfolio,
the mortgage fixed-rate loan portfolio and the mortgage servicing asset, all of which tend to be sensitive to
interest rate movements. Prepayments on mortgage-backed securities slowed during the latter half of 2008 due to
various factors associated with the housing crisis. Tighter lending standards, decreased home prices, and
uncertainty surrounding the economic environment created slower prepayment speeds on mortgage-backed
securities. Regions also has prepayment risk that would be reflected in non-interest income in the form of
servicing income on loans sold. In 2008, prepayment rates were lower compared to recent years; however the
Company anticipates the rate of prepayments to increase in 2009, driven primarily by the high refinancing
activity the Company has experienced since the start of the year. Regions actively monitors prepayment exposure
as part of its overall net interest income forecasting and interest rate risk management.
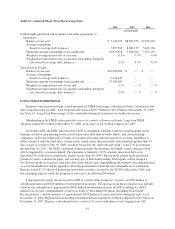
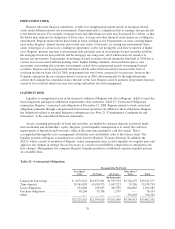
LIQUIDITY RISK
Liquidity is an important factor in the financial condition of Regions and affects Regions’ ability to meet the
borrowing needs and deposit withdrawal requirements of its customers. Table 21 “Contractual Obligations”
summarizes Regions’ contractual cash obligations at December 31, 2008. Regions intends to fund contractual
obligations primarily through cash generated from normal operations. In addition to these obligations, Regions
has obligations related to potential litigation contingencies (see Note 25 “Commitments, Contingencies and
Guarantees” to the consolidated financial statements).
Assets, consisting principally of loans and securities, are funded by customer deposits, purchased funds,
borrowed funds and stockholders’ equity. Regions’ goal in liquidity management is to satisfy the cash flow
requirements of depositors and borrowers, while at the same time meeting its cash flow needs. This is
accomplished through the active management of both the asset and liability sides of the balance sheet. The
liquidity position of Regions is monitored on a daily basis by Regions’ Treasury Division. In addition, the
ALCO, which consists of members of Regions’ senior management team, reviews liquidity on a regular basis and
approves any changes in strategy that are necessary as a result of asset/liability composition or anticipated cash
flow changes. Management also compares Regions’ liquidity position to established corporate liquidity policies
on a monthly basis.
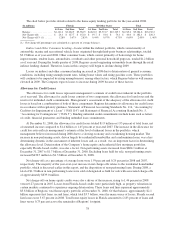
Table 21—Contractual Obligations
Payments Due By Period
Less than 1
Year 1-3 Years 4-5 Years
More than 5
Years Total
(In thousands)
Long-term borrowings ............... $ 2,671,023 $10,875,851 $1,955,924 $3,728,479 $19,231,277
Time deposits ..................... 20,361,650 10,430,575 1,647,223 39,286 32,478,734
Lease obligations ................... 154,646 256,635 205,559 644,845 1,261,685
Purchase obligations ................ 38,206 35,558 2,339 — 76,103
Other ............................ — — — 354,343 354,343
$23,225,525 $21,598,619 $3,811,045 $4,766,953 $53,402,142
70