Regions Bank 2008 Annual Report Download - page 122
Download and view the complete annual report
Please find page 122 of the 2008 Regions Bank annual report below. You can navigate through the pages in the report by either clicking on the pages listed below, or by using the keyword search tool below to find specific information within the annual report.-
 1
1 -
2
-
3
-
4
-
5
-
6
-
7
-
8
-
9
-
10
-
11
-
12
-
13
-
14
-
15
-
16
-
17
-
18
-
19
-
20
-
21
-
22
-
23
-
24
-
25
-
26
-
27
-
28
-
29
-
30
-
31
-
32
-
33
-
34
-
35
-
36
-
37
-
38
-
39
-
40
-
41
-
42
-
43
-
44
-
45
-
46
-
47
-
48
-
49
-
50
-
51
-
52
-
53
-
54
-
55
-
56
-
57
-
58
-
59
-
60
-
61
-
62
-
63
-
64
-
65
-
66
-
67
-
68
-
69
-
70
-
71
-
72
-
73
-
74
-
75
-
76
-
77
-
78
-
79
-
80
-
81
-
82
-
83
-
84
-
85
-
86
-
87
-
88
-
89
-
90
-
91
-
92
-
93
-
94
-
95
-
96
-
97
-
98
-
99
-
100
-
101
-
102
-
103
-
104
-
105
-
106
-
107
-
108
-
109
-
110
-
111
-
 112
112 -
 113
113 -
 114
114 -
 115
115 -
 116
116 -
 117
117 -
 118
118 -
 119
119 -
 120
120 -
 121
121 -
 122
122 -
 123
123 -
 124
124 -
 125
125 -
 126
126 -
 127
127 -
 128
128 -
 129
129 -
 130
130 -
 131
131 -
 132
132 -
133
-
134
-
135
-
136
-
137
-
138
-
139
-
140
-
141
-
142
-
143
-
144
-
145
-
146
-
147
-
148
-
149
-
150
-
151
-
152
-
153
-
154
-
155
-
156
-
157
-
158
-
159
-
160
-
161
-
162
-
163
-
164
-
165
-
166
-
167
-
168
-
169
-
170
-
171
-
172
-
173
-
174
-
175
-
176
-
177
-
178
-
179
-
180
-
181
-
182
-
183
-
184
 |
 |

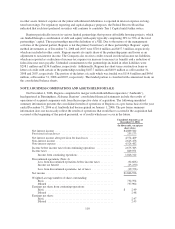
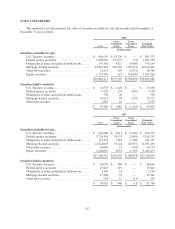
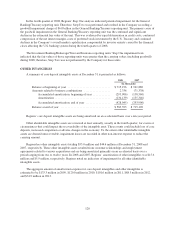
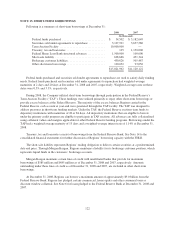
NOTE 5. SECURITIES
The amortized cost and estimated fair value of securities available for sale and securities held to maturity at
December 31 are as follows:
2008
Cost
Gross
Unrealized
Gains
Gross
Unrealized
Losses
Estimated
Fair Value
(In thousands)
Securities available for sale:
U.S. Treasury securities ........................ $ 801,999 $ 83,726 $ — $ 885,725
Federal agency securities ....................... 1,520,636 175,375 (53) 1,695,958
Obligations of states and political subdivisions ...... 755,365 8,827 (8,048) 756,144
Mortgage-backed securities ..................... 14,585,349 283,303 (539,231) 14,329,421
Other debt securities .......................... 21,412 105 (2,551) 18,966
Equity securities .............................. 1,177,450 427 (14,609) 1,163,268
$18,862,211 $551,763 $(564,492) $18,849,482
Securities held to maturity:
U.S. Treasury securities ........................ $ 14,578 $ 1,120 $ — $ 15,698
Federal agency securities ....................... 9,728 274 (876) 9,126
Obligations of states and political subdivisions ...... 550 20 — 570
Mortgage-backed securities ..................... 19,921 58 (257) 19,722
Other debt securities .......................... 2,529 10 — 2,539
$ 47,306 $ 1,482 $ (1,133) $ 47,655
2007
Cost
Gross
Unrealized
Gains
Gross
Unrealized
Losses
Estimated
Fair Value
(In thousands)
Securities available for sale:
U.S. Treasury securities ........................ $ 944,306 $ 5,611 $ (3,320) $ 946,597
Federal agency securities ....................... 3,224,350 93,972 (2,089) 3,316,233
Obligations of states and political subdivisions ...... 725,351 7,585 (1,769) 731,167
Mortgage-backed securities ..................... 11,024,643 91,124 (40,337) 11,075,430
Other debt securities .......................... 45,046 91 (963) 44,174
Equity securities .............................. 1,204,816 1,052 (1,395) 1,204,473
$17,168,512 $199,435 $ (49,873) $17,318,074
Securities held to maturity:
U.S. Treasury securities ........................ $ 18,050 $ 586 $ — $ 18,636
Federal agency securities ....................... 13,423 219 — 13,642
Obligations of states and political subdivisions ...... 1,200 16 — 1,216
Mortgage-backed securities ..................... 17,328 33 — 17,361
Other debt securities .......................... 934 12 (11) 935
$ 50,935 $ 866 $ (11) $ 51,790
112