Regions Bank 2008 Annual Report Download - page 62
Download and view the complete annual report
Please find page 62 of the 2008 Regions Bank annual report below. You can navigate through the pages in the report by either clicking on the pages listed below, or by using the keyword search tool below to find specific information within the annual report.-
 1
1 -
2
-
3
-
4
-
5
-
6
-
7
-
8
-
9
-
10
-
11
-
12
-
13
-
14
-
15
-
16
-
17
-
18
-
19
-
20
-
21
-
22
-
23
-
24
-
25
-
26
-
27
-
28
-
29
-
30
-
31
-
32
-
33
-
34
-
35
-
36
-
37
-
38
-
39
-
40
-
41
-
42
-
43
-
44
-
45
-
46
-
47
-
48
-
49
-
50
-
51
-
 52
52 -
 53
53 -
 54
54 -
 55
55 -
 56
56 -
 57
57 -
 58
58 -
 59
59 -
 60
60 -
 61
61 -
 62
62 -
 63
63 -
 64
64 -
 65
65 -
 66
66 -
 67
67 -
 68
68 -
 69
69 -
 70
70 -
 71
71 -
 72
72 -
73
-
74
-
75
-
76
-
77
-
78
-
79
-
80
-
81
-
82
-
83
-
84
-
85
-
86
-
87
-
88
-
89
-
90
-
91
-
92
-
93
-
94
-
95
-
96
-
97
-
98
-
99
-
100
-
101
-
102
-
103
-
104
-
105
-
106
-
107
-
108
-
109
-
110
-
111
-
112
-
113
-
114
-
115
-
116
-
117
-
118
-
119
-
120
-
121
-
122
-
123
-
124
-
125
-
126
-
127
-
128
-
129
-
130
-
131
-
132
-
133
-
134
-
135
-
136
-
137
-
138
-
139
-
140
-
141
-
142
-
143
-
144
-
145
-
146
-
147
-
148
-
149
-
150
-
151
-
152
-
153
-
154
-
155
-
156
-
157
-
158
-
159
-
160
-
161
-
162
-
163
-
164
-
165
-
166
-
167
-
168
-
169
-
170
-
171
-
172
-
173
-
174
-
175
-
176
-
177
-
178
-
179
-
180
-
181
-
182
-
183
-
184
 |
 |

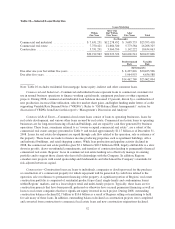
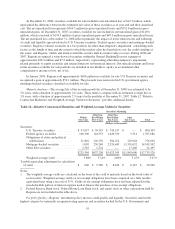
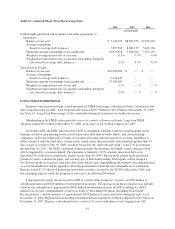
Table 10—Selected Loan Maturities
Loans Maturing
Within
One Year
After One
But Within
Five Years
After
Five Years Total
(In thousands)
Commercial and industrial ..................... $ 7,631,231 $12,278,452 $ 3,685,735 $23,595,418
Commercial real estate ........................ 7,750,421 12,684,320 5,773,584 26,208,325
Construction ................................ 5,531,291 3,960,550 1,142,222 10,634,063
$20,912,943 $28,923,322 $10,601,541 $60,437,806
Predetermined
Rate
Variable
Rate
(In thousands)
Due after one year but within five years ................................... $ 8,497,816 $20,425,506
Due after five years ................................................... 5,964,953 4,636,588
$14,462,769 $25,062,094
Note: Table 10 excludes residential first mortgage, home equity, indirect and other consumer loans.
Commercial and Industrial—Commercial and industrial loans represent loans to commercial customers for
use in normal business operations to finance working capital needs, equipment purchases or other expansion
projects. During 2008, commercial and industrial loan balances increased 13 percent, driven by a combination of
new production, increased line utilization, selective market share gains, and higher funding under letters of credit
supporting Variable Rate Demand Notes (“VRDNs”). Refer to “Off-Balance Sheet Arrangements” section for
discussion of VRDNs found later in this report’s “Management’s Discussion and Analysis”.
Commercial Real Estate—Commercial real estate loans consist of loans to operating businesses, loans for
real estate development, and various other loans secured by real estate. Commercial real estate loans to operating
businesses are for long-term financing of land and buildings, and are repaid by cash flow generated by business
operations. These loans, sometimes referred to as “owner occupied commercial real estate”, are a subset of the
commercial real estate category presented in Table 9, and totaled approximately $11.7 billion as of December 31,
2008. Loans for real estate development are repaid through cash flow related to the operation, sale or refinance of
the property. These loans are made to finance income-producing properties such as apartment buildings, office
and industrial buildings, and retail shopping centers. While loan production and pipeline activity declined in
2008, the commercial real estate portfolio grew $3.1 billion to $26.2 billion in 2008, largely attributable to a slow
down in payoffs, draws on unfunded commitments, and transfers of construction lending to permanently financed
commercial real estate. Regions’ focus in commercial real estate lending is to effectively manage its existing
portfolio and to support those clients who have full relationships with the Company. In addition, Regions
considers new projects with sound sponsorship and fundamentals and which meet the Company’s standards for
risk-adjusted return on capital.
Construction—Construction loans are loans to individuals, companies or developers used for the purchase
or construction of a commercial property for which repayment will be generated by cash flows related to the
operation, sale or refinance to permanent financing of the property. A significant portion of Regions’ real estate
construction portfolio is comprised of residential product types (land, single-family and condominium loans)
within Regions’ markets, and to a lesser degree retail and multi-family projects. Typically, these loans are for
construction projects that have been presold, preleased or otherwise have secured permanent financing as well as
loans to real estate companies that have significant equity invested in each project. During 2008, outstanding
construction balances declined $2.7 billion to $10.6 billion as a result of Regions selling or transferring to held
for sale many of these loans. In addition, outstanding balances declined as construction projects were completed
and converted from construction to commercial real estate loans and new construction originations declined.
52