Regions Bank 2008 Annual Report Download - page 67
Download and view the complete annual report
Please find page 67 of the 2008 Regions Bank annual report below. You can navigate through the pages in the report by either clicking on the pages listed below, or by using the keyword search tool below to find specific information within the annual report.-
 1
1 -
2
-
3
-
4
-
5
-
6
-
7
-
8
-
9
-
10
-
11
-
12
-
13
-
14
-
15
-
16
-
17
-
18
-
19
-
20
-
21
-
22
-
23
-
24
-
25
-
26
-
27
-
28
-
29
-
30
-
31
-
32
-
33
-
34
-
35
-
36
-
37
-
38
-
39
-
40
-
41
-
42
-
43
-
44
-
45
-
46
-
47
-
48
-
49
-
50
-
51
-
52
-
53
-
54
-
55
-
56
-
 57
57 -
 58
58 -
 59
59 -
 60
60 -
 61
61 -
 62
62 -
 63
63 -
 64
64 -
 65
65 -
 66
66 -
 67
67 -
 68
68 -
 69
69 -
 70
70 -
 71
71 -
 72
72 -
 73
73 -
 74
74 -
 75
75 -
 76
76 -
 77
77 -
78
-
79
-
80
-
81
-
82
-
83
-
84
-
85
-
86
-
87
-
88
-
89
-
90
-
91
-
92
-
93
-
94
-
95
-
96
-
97
-
98
-
99
-
100
-
101
-
102
-
103
-
104
-
105
-
106
-
107
-
108
-
109
-
110
-
111
-
112
-
113
-
114
-
115
-
116
-
117
-
118
-
119
-
120
-
121
-
122
-
123
-
124
-
125
-
126
-
127
-
128
-
129
-
130
-
131
-
132
-
133
-
134
-
135
-
136
-
137
-
138
-
139
-
140
-
141
-
142
-
143
-
144
-
145
-
146
-
147
-
148
-
149
-
150
-
151
-
152
-
153
-
154
-
155
-
156
-
157
-
158
-
159
-
160
-
161
-
162
-
163
-
164
-
165
-
166
-
167
-
168
-
169
-
170
-
171
-
172
-
173
-
174
-
175
-
176
-
177
-
178
-
179
-
180
-
181
-
182
-
183
-
184
 |
 |

preferred stock investment by the U.S. Treasury and continued declines in the Company’s overall market
capitalization, compounded by investor anxiety caused by the financial crises affecting the U.S. banking system.
See Note 1 “Summary of Significant Accounting Policies” and Note 10 “Intangible Assets” to the consolidated
financial statements for additional details.
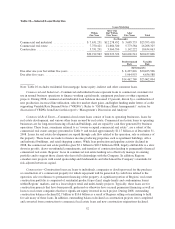
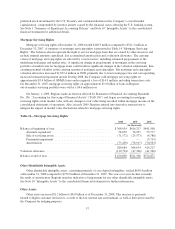
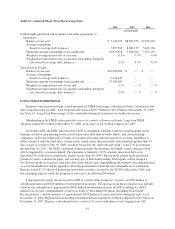
Mortgage Servicing Rights
Mortgage servicing rights at December 31, 2008 totaled $160.9 million compared to $321.3 million at
December 31, 2007. A summary of mortgage servicing rights is presented in Table 14 “Mortgage Servicing
Rights.” The balances shown represent the right to service mortgage loans that are owned by other investors and
include original amounts capitalized, less accumulated amortization and a valuation allowance. The carrying
values of mortgage servicing rights are affected by various factors, including estimated prepayments of the
underlying mortgages and market rates. A significant change in prepayments of mortgages in the servicing
portfolio or market rates for mortgage loans could result in significant changes in the valuation adjustments, thus
creating potential volatility in the carrying amount of mortgage servicing rights. The mortgage servicing rights
valuation allowance increased by $72.4 million in 2008, primarily due to lower mortgage rates and corresponding
increased estimated prepayment speeds. During 2008, the Company sold mortgage servicing rights on
approximately $3.4 billion of GNMA loans and recognized a loss of $14.9 million, including transaction costs.
On December 31, 2007, mortgage servicing rights on approximately $1.9 billion of loans in Regions’
out-of-market servicing portfolio were sold at a $4.4 million loss.
On January 1, 2009, Regions made an election allowed by Statement of Financial Accounting Standards
No. 156, “Accounting for Servicing of Financial Assets” (“FAS 156”) and began accounting for mortgage
servicing rights at fair market value with any changes to fair value being recorded within mortgage income on the
consolidated statements of operations. Also, in early 2009, Regions entered into derivative transactions to
mitigate the impact of market value fluctuations related to mortgage servicing rights.
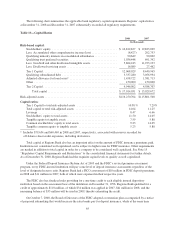
Table 14—Mortgage Servicing Rights
2008 2007 2006
(In thousands)
Balance at beginning of year ....................................... $368,654 $416,217 $441,508
Amounts capitalized ......................................... 58,632 56,931 53,777
Sale of servicing assets ....................................... (71,172) (25,577) (4,786)
Permanent impairment ....................................... — — (3,719)
Amortization ............................................... (75,430) (78,917) (70,563)
280,684 368,654 416,217
Valuation allowance ............................................. (119,794) (47,346) (41,346)
Balance at end of year ............................................ $160,890 $321,308 $374,871
Other Identifiable Intangible Assets
Other identifiable intangible assets, consisting primarily of core deposit intangibles, totaled $638.4 million
at December 31, 2008 compared to $759.8 million at December 31, 2007. The year-over-year decline is mainly
the result of amortization. Regions noted no indicators of impairment for any other identifiable intangible assets.
See Note 10 “Intangible Assets” to the consolidated financial statements for further information.
Other Assets
Other assets increased $1.2 billion to $8.0 billion as of December 31, 2008. This increase is primarily
related to higher customer derivatives, a result of the low interest rate environment, as well as derivatives used by
the Company for hedging purposes.
57