Regions Bank 2008 Annual Report Download - page 40
Download and view the complete annual report
Please find page 40 of the 2008 Regions Bank annual report below. You can navigate through the pages in the report by either clicking on the pages listed below, or by using the keyword search tool below to find specific information within the annual report.-
 1
1 -
2
-
3
-
4
-
5
-
6
-
7
-
8
-
9
-
10
-
11
-
12
-
13
-
14
-
15
-
16
-
17
-
18
-
19
-
20
-
21
-
22
-
23
-
24
-
25
-
26
-
27
-
28
-
29
-
 30
30 -
 31
31 -
 32
32 -
 33
33 -
 34
34 -
 35
35 -
 36
36 -
 37
37 -
 38
38 -
 39
39 -
 40
40 -
 41
41 -
 42
42 -
 43
43 -
 44
44 -
 45
45 -
 46
46 -
 47
47 -
 48
48 -
 49
49 -
 50
50 -
51
-
52
-
53
-
54
-
55
-
56
-
57
-
58
-
59
-
60
-
61
-
62
-
63
-
64
-
65
-
66
-
67
-
68
-
69
-
70
-
71
-
72
-
73
-
74
-
75
-
76
-
77
-
78
-
79
-
80
-
81
-
82
-
83
-
84
-
85
-
86
-
87
-
88
-
89
-
90
-
91
-
92
-
93
-
94
-
95
-
96
-
97
-
98
-
99
-
100
-
101
-
102
-
103
-
104
-
105
-
106
-
107
-
108
-
109
-
110
-
111
-
112
-
113
-
114
-
115
-
116
-
117
-
118
-
119
-
120
-
121
-
122
-
123
-
124
-
125
-
126
-
127
-
128
-
129
-
130
-
131
-
132
-
133
-
134
-
135
-
136
-
137
-
138
-
139
-
140
-
141
-
142
-
143
-
144
-
145
-
146
-
147
-
148
-
149
-
150
-
151
-
152
-
153
-
154
-
155
-
156
-
157
-
158
-
159
-
160
-
161
-
162
-
163
-
164
-
165
-
166
-
167
-
168
-
169
-
170
-
171
-
172
-
173
-
174
-
175
-
176
-
177
-
178
-
179
-
180
-
181
-
182
-
183
-
184
 |
 |

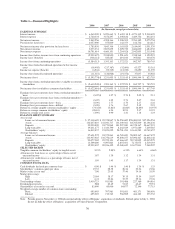
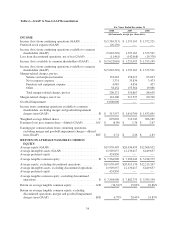
Table 1—Financial Highlights
2008 2007 2006 2005 2004
(In thousands, except per share data)
EARNINGS SUMMARY
Interest income ........................................ $ 6,563,390 $ 8,074,663 $ 5,649,118 $ 4,271,145 $ 2,918,405
Interest expense ....................................... 2,720,434 3,676,297 2,340,816 1,489,756 842,651
Net interest income ..................................... 3,842,956 4,398,366 3,308,302 2,781,389 2,075,754
Provision for loan losses ................................ 2,057,000 555,000 142,373 166,746 124,215
Net interest income after provision for loan losses ............ 1,785,956 3,843,366 3,165,929 2,614,643 1,951,539
Non-interest income .................................... 3,073,231 2,855,835 2,029,720 1,686,820 1,484,230
Non-interest expense ................................... 10,791,614 4,660,351 3,204,028 2,942,895 2,315,548
Income (loss) before income taxes from continuing operations . . (5,932,427) 2,038,850 1,991,621 1,358,568 1,120,221
Income taxes (benefits) ................................. (348,114) 645,687 619,100 395,861 330,478
Income (loss) from continuing operations ................... (5,584,313) 1,393,163 1,372,521 962,707 789,743
Income (loss) from discontinued operations before income
taxes .............................................. (18,405) (217,387) (32,606) 63,527 55,361
Income tax expense (benefit) ............................. (6,944) (75,319) (13,230) 25,690 21,339
Income (loss) from discontinued operations ................. (11,461) (142,068) (19,376) 37,837 34,022
Net income (loss) ...................................... $ (5,595,774) $ 1,251,095 $ 1,353,145 $ 1,000,544 $ 823,765
Income (loss) from continuing operations available to common
shareholders ........................................ $ (5,610,549) $ 1,393,163 $ 1,372,521 $ 962,707 $ 783,723
Net income (loss) available to common shareholders .......... $ (5,622,010) $ 1,251,095 $ 1,353,145 $ 1,000,544 $ 817,745
Earnings (loss) per common share from continuing operations—
basic .............................................. $ (8.07) $ 1.97 $ 2.74 $ 2.09 $ 2.13
Earnings (loss) per common share from continuing operations—
diluted ............................................. (8.07) 1.95 2.71 2.07 2.10
Earnings (loss) per common share—basic ................... (8.09) 1.77 2.70 2.17 2.22
Earnings (loss) per common share—diluted ................. (8.09) 1.76 2.67 2.15 2.19
Return on average tangible common stockholders’ equity ...... (74.32)% 15.82% 22.86% 18.80% 18.97%
Return on average common stockholders’ equity ............. (28.81) 6.24 10.94 9.37 10.91
Return on average total assets ............................ (3.90) 0.90 1.41 1.18 1.23
BALANCE SHEET SUMMARY
At year end
Loans, net of unearned income ....................... $ 97,418,685 $ 95,378,847 $ 94,550,602 $58,404,913 $57,526,954
Assets ........................................... 146,247,810 141,041,717 143,369,021 84,785,600 84,106,438
Deposits ......................................... 90,903,890 94,774,968 101,227,969 60,378,367 58,667,023
Long-term debt .................................... 19,231,277 11,324,790 8,642,649 6,971,680 7,239,585
Stockholders’ equity ............................... 16,812,837 19,823,029 20,701,454 10,614,283 10,749,457
Average balances
Loans, net of unearned income ....................... 97,601,272 94,372,061 64,765,653 58,002,167 44,667,472
Assets ........................................... 143,947,025 138,756,619 95,800,277 85,096,467 66,838,148
Deposits ......................................... 90,077,002 95,725,101 67,466,447 59,712,895 45,015,279
Long-term debt .................................... 13,509,689 9,697,823 6,855,601 7,175,075 6,519,193
Stockholders’ equity ............................... 19,939,407 20,036,459 12,368,632 10,677,831 7,548,207
SELECTED RATIOS
Tangible common stockholders’ equity to tangible assets ...... 5.23% 5.88% 6.53% 6.64% 6.86%
Allowance for loan losses as a percentage of loans, net of
unearned income .................................... 1.87 1.39 1.12 1.34 1.31
Allowance for credit losses as a percentage of loans, net of
unearned income .................................... 1.95 1.45 1.17 1.34 1.31
COMMON STOCK DATA
Cash dividends declared per common share ................. $ 0.96 $ 1.46 $ 1.40 $ 1.36 $ 1.33
Stockholders’ common equity per share .................... 19.53 28.58 28.36 23.26 23.06
Market value at year end ................................ 7.96 23.65 37.40 34.16 35.59
Market price range:
High ............................................ 25.84 38.17 39.15 35.54 35.97
Low............................................. 6.41 22.84 32.37 29.16 27.26
Total trading volume ................................... 3,410,723 911,981 301,488 227,380 194,916
Dividend payout ratio ................................... NM 82.49 51.85 62.67 59.91
Shareholders of record at year end ......................... 83,600 85,060 84,877 72,140 77,715
Weighted-average number of common shares outstanding
Basic ............................................ 695,003 707,981 501,681 461,171 368,656
Diluted .......................................... 695,003 712,743 506,989 466,183 373,732
Note: Periods prior to November 4, 2006 do not include the effect of Regions’ acquisition of AmSouth. Periods prior to July 1, 2004
do not include the effect of Regions’ acquisition of Union Planters Corporation.
30