Regions Bank 2008 Annual Report Download - page 42
Download and view the complete annual report
Please find page 42 of the 2008 Regions Bank annual report below. You can navigate through the pages in the report by either clicking on the pages listed below, or by using the keyword search tool below to find specific information within the annual report.-
 1
1 -
2
-
3
-
4
-
5
-
6
-
7
-
8
-
9
-
10
-
11
-
12
-
13
-
14
-
15
-
16
-
17
-
18
-
19
-
20
-
21
-
22
-
23
-
24
-
25
-
26
-
27
-
28
-
29
-
30
-
31
-
 32
32 -
 33
33 -
 34
34 -
 35
35 -
 36
36 -
 37
37 -
 38
38 -
 39
39 -
 40
40 -
 41
41 -
 42
42 -
 43
43 -
 44
44 -
 45
45 -
 46
46 -
 47
47 -
 48
48 -
 49
49 -
 50
50 -
 51
51 -
 52
52 -
53
-
54
-
55
-
56
-
57
-
58
-
59
-
60
-
61
-
62
-
63
-
64
-
65
-
66
-
67
-
68
-
69
-
70
-
71
-
72
-
73
-
74
-
75
-
76
-
77
-
78
-
79
-
80
-
81
-
82
-
83
-
84
-
85
-
86
-
87
-
88
-
89
-
90
-
91
-
92
-
93
-
94
-
95
-
96
-
97
-
98
-
99
-
100
-
101
-
102
-
103
-
104
-
105
-
106
-
107
-
108
-
109
-
110
-
111
-
112
-
113
-
114
-
115
-
116
-
117
-
118
-
119
-
120
-
121
-
122
-
123
-
124
-
125
-
126
-
127
-
128
-
129
-
130
-
131
-
132
-
133
-
134
-
135
-
136
-
137
-
138
-
139
-
140
-
141
-
142
-
143
-
144
-
145
-
146
-
147
-
148
-
149
-
150
-
151
-
152
-
153
-
154
-
155
-
156
-
157
-
158
-
159
-
160
-
161
-
162
-
163
-
164
-
165
-
166
-
167
-
168
-
169
-
170
-
171
-
172
-
173
-
174
-
175
-
176
-
177
-
178
-
179
-
180
-
181
-
182
-
183
-
184
 |
 |
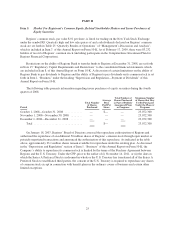
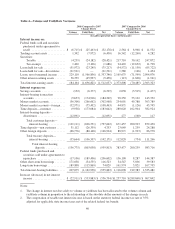
were also a driver of the increase in non-performing assets. Regions aggressively managed its exposure to its
most stressed assets by selling or transferring to held for sale approximately $1.3 billion of non-performing loans
during 2008. Non-performing assets held for sale totaled $423.3 million at December 31, 2008.
The provision for loan losses is used to maintain the allowance for loan losses at a level that, in
management’s judgment, is adequate to cover losses inherent in the loan portfolio as of the balance sheet date.
During 2008, the provision for loan losses from continuing operations increased to $2.1 billion compared to
$555.0 million in 2007. The provision rose due to weakening conditions in the broad economy and, more
specifically, in the residential housing market, which most significantly impacted management’s estimate of
inherent losses in the residential homebuilder, condominium, home equity and residential mortgage portfolios.
As a result of the increased provision for loan losses and despite significantly higher loan charge-offs, which
increased $1.3 billion, Regions increased its allowance for credit losses to 1.95 percent of total loans, net of
unearned income, at December 31, 2008, as compared to 1.45 percent at December 31, 2007.
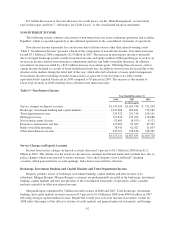
Non-interest income from continuing operations (excluding securities gains/losses) totaled $3.0 billion or 43
percent of total revenue (fully taxable-equivalent basis) in 2008 compared to $2.9 billion or 39 percent in 2007,
and continued to reflect Regions’ diversified revenue stream. The increase in non-interest income is primarily
due to strong brokerage, investment banking and capital markets income, especially during the first half of the
year. As the year progressed, however, brokerage and equity capital markets revenue streams were affected by
declining market activity and transaction flow, resulting from increasing overall market uncertainty. Despite the
difficulties, 2008 was a solid year for Morgan Keegan, recording net income of $128.3 million as compared to
$165.9 million in 2007. In addition, Regions recorded $62.8 million of other income due to proceeds from a sale
of Class B common stock ownership interest in Visa. Offsetting these increases were decreases in service charges
on deposit accounts and trust income in 2008.
Non-interest expense from continuing operations totaled $10.8 billion in 2008 compared to $4.7 billion in
2007, impacted most significantly by the $6.0 billion non-cash goodwill impairment charge. Also reflected in
non-interest expenses were merger charges totaling $200.2 million and $350.9 million in 2008 and 2007,
respectively. Merger costs consist mainly of personnel expenses, the cost of integrating AmSouth systems with
those of Regions and the consolidation of branches. Excluding the goodwill impairment and merger-related
expenses, non-interest expense increased $282.0 million or 6.5 percent in 2008 compared to 2007. The largest
drivers were mortgage servicing rights impairment charges, increased professional fees due to litigation,
occupancy expense reflecting continued investment in the branch franchise, and higher other real estate owned
expenses driven by losses related to the continued decline in the housing market. In addition, 2008 non-interest
expense was impacted by a $65.4 million loss on the early extinguishment of debt related to the redemption of
subordinated notes and $49.4 million in write-downs on the investment in two Morgan Keegan mutual funds. See
Table 8 “Non-Interest Expense (including Non-GAAP Reconciliation)” for further details. Salaries and employee
benefit cost were lower in 2008, mainly due to merger-related cost savings. Regions’ commission-driven
revenues such as brokerage, investment banking and mortgage did, and will continue to, impact the salaries and
employee benefits component of non-interest expense in direct correlation to revenue trends.
In December 2008, Regions reached an agreement with the Internal Revenue Service (“IRS”) that resolves a
broad range of tax issues for Regions and all of its predecessor companies. The agreement covers and effectively
closes Regions’ federal tax returns for tax years 1999 through 2006. As a result of the agreement, Regions
recorded a $275 million earnings benefit from a reduction in the Company’s income tax expense during the
fourth quarter of 2008. Refer to “Income Taxes” under “Operating Results” for additional details.
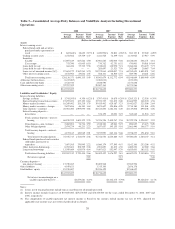
Total loans increased by 2.1 percent in 2008, driven mainly by commercial and industrial and home equity
lending. Partially offsetting this growth, demand for residential-related real estate lending softened during the
year, primarily a result of the challenging economic backdrop and industry-wide tightening of credit. Deposits
declined 4.1 percent in 2008 as compared to 2007, driven by a decline in foreign deposits utilized as an
alternative to overnight funding. Customer deposits, defined as total deposits less deposits used for corporate
32