Regions Bank 2008 Annual Report Download - page 94
Download and view the complete annual report
Please find page 94 of the 2008 Regions Bank annual report below. You can navigate through the pages in the report by either clicking on the pages listed below, or by using the keyword search tool below to find specific information within the annual report.-
 1
1 -
2
-
3
-
4
-
5
-
6
-
7
-
8
-
9
-
10
-
11
-
12
-
13
-
14
-
15
-
16
-
17
-
18
-
19
-
20
-
21
-
22
-
23
-
24
-
25
-
26
-
27
-
28
-
29
-
30
-
31
-
32
-
33
-
34
-
35
-
36
-
37
-
38
-
39
-
40
-
41
-
42
-
43
-
44
-
45
-
46
-
47
-
48
-
49
-
50
-
51
-
52
-
53
-
54
-
55
-
56
-
57
-
58
-
59
-
60
-
61
-
62
-
63
-
64
-
65
-
66
-
67
-
68
-
69
-
70
-
71
-
72
-
73
-
74
-
75
-
76
-
77
-
78
-
79
-
80
-
81
-
82
-
83
-
 84
84 -
 85
85 -
 86
86 -
 87
87 -
 88
88 -
 89
89 -
 90
90 -
 91
91 -
 92
92 -
 93
93 -
 94
94 -
 95
95 -
 96
96 -
 97
97 -
 98
98 -
 99
99 -
 100
100 -
 101
101 -
 102
102 -
 103
103 -
 104
104 -
105
-
106
-
107
-
108
-
109
-
110
-
111
-
112
-
113
-
114
-
115
-
116
-
117
-
118
-
119
-
120
-
121
-
122
-
123
-
124
-
125
-
126
-
127
-
128
-
129
-
130
-
131
-
132
-
133
-
134
-
135
-
136
-
137
-
138
-
139
-
140
-
141
-
142
-
143
-
144
-
145
-
146
-
147
-
148
-
149
-
150
-
151
-
152
-
153
-
154
-
155
-
156
-
157
-
158
-
159
-
160
-
161
-
162
-
163
-
164
-
165
-
166
-
167
-
168
-
169
-
170
-
171
-
172
-
173
-
174
-
175
-
176
-
177
-
178
-
179
-
180
-
181
-
182
-
183
-
184
 |
 |

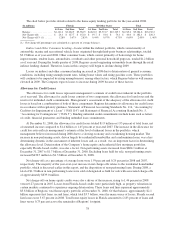
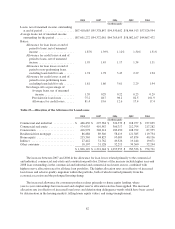
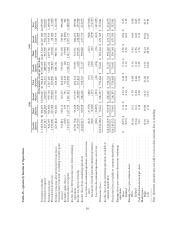
Table 24—Non-Performing Assets
2008 2007 2006 2005 2004
(In thousands)
Non-performing loans:
Commercial and industrial .............. $ 175,472 $ 92,029 $ 57,343 $ n/a $ n/a
Commercial real estate ................. 448,908 263,188 128,301 n/a n/a
Construction ......................... 298,604 310,052 56,625 n/a n/a
Residential first mortgage ............... 125,381 71,700 54,396 n/a n/a
Home equity ......................... 3,238 6,611 9,537 n/a n/a
Indirect ............................. 1 9 1 n/a n/a
Other consumer ....................... 166 — 268 n/a n/a
Total non-performing loans .................. 1,051,770 743,589 306,471 341,418 388,658
Foreclosed properties ...................... 242,961 120,465 72,663 65,459 63,598
Total non-performing assets* excluding
loans held for sale ................... 1,294,731 864,054 379,134 406,877 452,256
Non-performing loans held for sale ........... 423,255 ————
Total non-performing assets* ............ $1,717,986 $864,054 $379,134 $406,877 $452,256
Non-performing loans* to loans, net of unearned
income ................................ 1.08% 0.78% 0.32% 0.58% 0.68%
Non-performing assets* excluding loans held for
sale, to loans, net of unearned income and
foreclosed properties ..................... 1.33% 0.90% 0.40% 0.70% 0.79%
Non-performing assets* to loans, net of unearned
income and foreclosed properties ........... 1.76% 0.90% 0.40% 0.70% 0.79%
Accruing loans 90 days past due:
Commercial and industrial .............. $ 14,067 $ 12,055 $ 9,920 $ n/a $ n/a
Commercial real estate ................. 21,405 12,363 26,132 n/a n/a
Construction ......................... 14,416 18,930 15,174 n/a n/a
Residential first mortgage ............... 275,236 154,951 43,721 n/a n/a
Home equity ......................... 214,437 146,809 40,760 n/a n/a
Indirect ............................. 7,854 6,002 3,207 n/a n/a
Other consumer ....................... 6,943 5,575 4,954 n/a n/a
$ 554,358 $356,685 $143,868 $ 87,523 $ 74,777
Restructured loans not included in the categories
above ................................. $ 454,731 $ — $ — $ — $ —
* Exclusive of accruing loans 90 days past due
Note: Non-accrual loans and accruing loans 90 days past due by loan category are not available for periods prior
to 2006.
Loans past due 90 days or more and still accruing totaled $554.4 million as of year-end 2008, an increase of
$197.7 million from year-end 2007 levels, and reflected weaker economic conditions and general market
deterioration. The increase was primarily due to increases in home equity and residential first mortgages,
particularly in Florida, as well as commercial real estate loans being managed by the Special Assets Department
and in the process of collection.
Restructured loans at December 31, 2008, as disclosed above, were primarily comprised of $406.0 million
of residential first mortgage loans and $47.8 million of home equity lines and loans with modified terms and/or
rates. To address the growing needs of borrowers, as well as minimize losses, management instituted a Customer
84