Regions Bank 2008 Annual Report Download - page 160
Download and view the complete annual report
Please find page 160 of the 2008 Regions Bank annual report below. You can navigate through the pages in the report by either clicking on the pages listed below, or by using the keyword search tool below to find specific information within the annual report.-
 1
1 -
2
-
3
-
4
-
5
-
6
-
7
-
8
-
9
-
10
-
11
-
12
-
13
-
14
-
15
-
16
-
17
-
18
-
19
-
20
-
21
-
22
-
23
-
24
-
25
-
26
-
27
-
28
-
29
-
30
-
31
-
32
-
33
-
34
-
35
-
36
-
37
-
38
-
39
-
40
-
41
-
42
-
43
-
44
-
45
-
46
-
47
-
48
-
49
-
50
-
51
-
52
-
53
-
54
-
55
-
56
-
57
-
58
-
59
-
60
-
61
-
62
-
63
-
64
-
65
-
66
-
67
-
68
-
69
-
70
-
71
-
72
-
73
-
74
-
75
-
76
-
77
-
78
-
79
-
80
-
81
-
82
-
83
-
84
-
85
-
86
-
87
-
88
-
89
-
90
-
91
-
92
-
93
-
94
-
95
-
96
-
97
-
98
-
99
-
100
-
101
-
102
-
103
-
104
-
105
-
106
-
107
-
108
-
109
-
110
-
111
-
112
-
113
-
114
-
115
-
116
-
117
-
118
-
119
-
120
-
121
-
122
-
123
-
124
-
125
-
126
-
127
-
128
-
129
-
130
-
131
-
132
-
133
-
134
-
135
-
136
-
137
-
138
-
139
-
140
-
141
-
142
-
143
-
144
-
145
-
146
-
147
-
148
-
149
-
 150
150 -
 151
151 -
 152
152 -
 153
153 -
 154
154 -
 155
155 -
 156
156 -
 157
157 -
 158
158 -
 159
159 -
 160
160 -
 161
161 -
 162
162 -
 163
163 -
 164
164 -
 165
165 -
 166
166 -
 167
167 -
 168
168 -
 169
169 -
 170
170 -
171
-
172
-
173
-
174
-
175
-
176
-
177
-
178
-
179
-
180
-
181
-
182
-
183
-
184
 |
 |

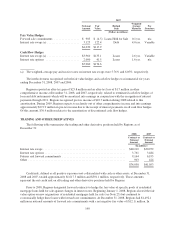
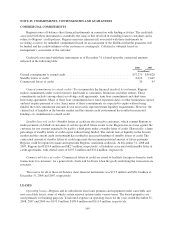
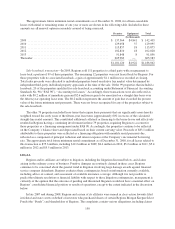
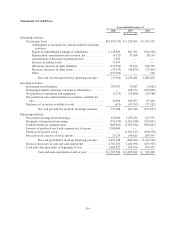
The approximate future minimum rental commitments as of December 31, 2008, for all non-cancelable
leases with initial or remaining terms of one year or more are shown in the following table. Included in these
amounts are all renewal options reasonably assured of being exercised.
Premises Equipment Total
(In thousands)
2009 ....................................................... $ 137,564 $4,841 $ 142,405
2010 ....................................................... 129,058 37 129,095
2011 ....................................................... 113,857 18 113,875
2012 ....................................................... 102,810 18 102,828
2013 ....................................................... 91,848 8 91,856
Thereafter ................................................... 605,983 — 605,983
$1,181,120 $4,922 $1,186,042
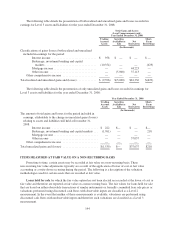
Sale-leaseback transaction—In 2005, Regions sold 111 properties to a third party with an agreement to
lease back a portion of 99 of these properties. The remaining 12 properties were not leased back by Regions. For
those properties with no associated leaseback, a gain of approximately $1.1 million was recorded at closing.
Total sales proceeds were allocated to individual properties based on relative fair market value determined by
independent third-party individual property appraisals at the time of the sale. Of the 99 properties that included a
leaseback, 20 of the properties qualified for sale-leaseback accounting under Statement of Financial Accounting
Standards No. 98 (“FAS 98”), “Accounting for Leases.” Accordingly, these transactions were also reflected as
sales with $0.2 million of immediate gain and $2.6 million in gain to be amortized on a straight-line basis over
the fifteen-year operating lease term. The $0.2 million represents the amount of gain that exceeded the present
value of the future minimum rent payments. There were no losses recognized for any of the properties subject to
the sale-leaseback.
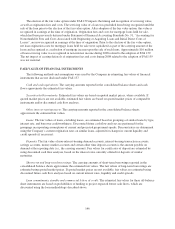
The other 79 properties included lease terms that require lease payments that are significantly more heavily
weighted toward the early years of the fifteen-year lease term (approximately 60% in excess of the calculated
straight-line rental amount). This constituted additional collateral or financing to the buyer-lessor and effectively
resulted in Regions having a continuing involvement in these 79 properties, requiring Regions to account for
these properties as a financing arrangement under FAS 98. Accordingly, the properties continue to be reflected
on the Company’s balance sheet and depreciated based on their current carrying value. Proceeds of $83.1 million
attributable to these properties were reflected as a financing obligation with monthly rental payments due,
reflected as a component of principal reduction and interest expense at the Company’s incremental borrowing
rate. The approximate total future minimum rental commitment as of December 31, 2008, for all leases related to
this transaction is $75.6 million, including $12.2 million in 2009, $8.4 million in 2010, $5.2 million in 2011, $5.4
million in 2012 and $5.5 million in 2013.
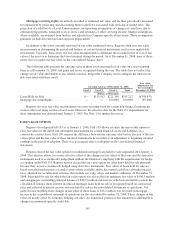
LEGAL
Regions and its affiliates are subject to litigation, including the litigation discussed below, and claims
arising in the ordinary course of business. Punitive damages are routinely claimed in these cases. Regions
continues to be concerned about the general trend in litigation involving large damage awards against financial
service company defendants. Regions evaluates these contingencies based on information currently available,
including advice of counsel, and assessment of available insurance coverage. Although it is not possible to
predict the ultimate resolution or financial liability with respect to these litigation contingencies, management is
currently of the opinion that the outcome of pending and threatened litigation would not have a material effect on
Regions’ consolidated financial position or results of operations, except to the extent indicated in the discussion
below.
In late 2007 and during 2008, Regions and certain of its affiliates were named in class-action lawsuits filed
in federal and state courts on behalf of investors who purchased shares of certain Regions Morgan Keegan Select
Funds (the “Funds”) and shareholders of Regions. The complaints contain various allegations, including claims
150