Regions Bank 2008 Annual Report Download - page 64
Download and view the complete annual report
Please find page 64 of the 2008 Regions Bank annual report below. You can navigate through the pages in the report by either clicking on the pages listed below, or by using the keyword search tool below to find specific information within the annual report.-
 1
1 -
2
-
3
-
4
-
5
-
6
-
7
-
8
-
9
-
10
-
11
-
12
-
13
-
14
-
15
-
16
-
17
-
18
-
19
-
20
-
21
-
22
-
23
-
24
-
25
-
26
-
27
-
28
-
29
-
30
-
31
-
32
-
33
-
34
-
35
-
36
-
37
-
38
-
39
-
40
-
41
-
42
-
43
-
44
-
45
-
46
-
47
-
48
-
49
-
50
-
51
-
52
-
53
-
 54
54 -
 55
55 -
 56
56 -
 57
57 -
 58
58 -
 59
59 -
 60
60 -
 61
61 -
 62
62 -
 63
63 -
 64
64 -
 65
65 -
 66
66 -
 67
67 -
 68
68 -
 69
69 -
 70
70 -
 71
71 -
 72
72 -
 73
73 -
 74
74 -
75
-
76
-
77
-
78
-
79
-
80
-
81
-
82
-
83
-
84
-
85
-
86
-
87
-
88
-
89
-
90
-
91
-
92
-
93
-
94
-
95
-
96
-
97
-
98
-
99
-
100
-
101
-
102
-
103
-
104
-
105
-
106
-
107
-
108
-
109
-
110
-
111
-
112
-
113
-
114
-
115
-
116
-
117
-
118
-
119
-
120
-
121
-
122
-
123
-
124
-
125
-
126
-
127
-
128
-
129
-
130
-
131
-
132
-
133
-
134
-
135
-
136
-
137
-
138
-
139
-
140
-
141
-
142
-
143
-
144
-
145
-
146
-
147
-
148
-
149
-
150
-
151
-
152
-
153
-
154
-
155
-
156
-
157
-
158
-
159
-
160
-
161
-
162
-
163
-
164
-
165
-
166
-
167
-
168
-
169
-
170
-
171
-
172
-
173
-
174
-
175
-
176
-
177
-
178
-
179
-
180
-
181
-
182
-
183
-
184
 |
 |

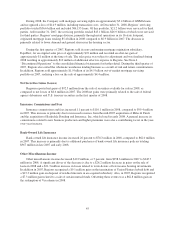
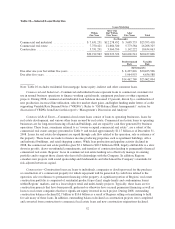
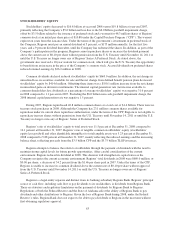
Loans Held for Sale
At December 31, 2008, loans held for sale totaled $1.3 billion, consisting of $420 million of non-performing
commercial real estate and construction loans, $513 million of residential real estate mortgage loans, and $349
million of student loans. At December 31, 2007, loans held for sale totaled $720.9 million, consisting solely of
residential real estate mortgage loans in the process of being sold to third parties.
During 2008, in an effort to manage its exposure to non-performing assets, Regions made a strategic
decision to intensify its efforts to sell certain portions of non-performing loans. During 2008, the Company sold
or classified as loans held for sale $1.3 billion of non-performing loans through its efforts. Regions marks all
loans to the lower of cost or market value at the time they are classified as held for sale and continues to evaluate
valuation at each reporting period.
Lower residential first origination volumes and tightening of the secondary market for residential mortgage
production—a result of the weakening housing market in 2008—somewhat offset the increase in loans held for
sale resulting from the increased commercial sales activity described above. Refer to the “Credit Risk” section
later in this report for more discussion on asset quality and non-performing assets.
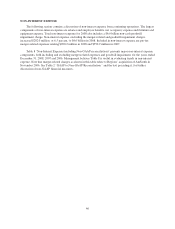
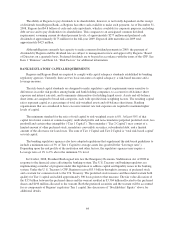
Allowance for Credit Losses
The allowance for credit losses represents management’s estimate of credit losses inherent in both the loan
portfolio and unfunded credit commitments as of the balance sheet date. The allowance consists of two
components: the allowance for loans losses, which is recorded as a contra-asset to loans, and the reserve for
unfunded credit commitments, which is recorded in other liabilities. At December 31, 2008, the allowance for
credit losses totaled $1.9 billion or 1.95 percent of loans, net of unearned income, compared to $1.4 billion or
1.45 percent at year-end 2007. See “Allowance for Credit Losses” in the “Risk Management” section found later
in this report for a detailed discussion of the allowance.
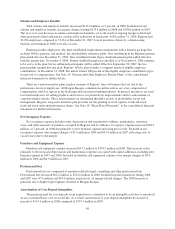
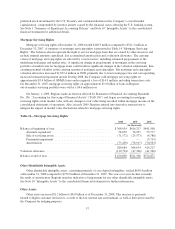
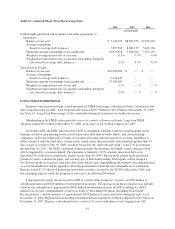
Securities
Regions utilizes the securities portfolio to manage liquidity, interest rate risk, regulatory capital, and to take
advantage of market conditions to generate a favorable return on investments without undue risk. The portfolio
consists primarily of high-quality mortgage-backed and asset-backed securities, as well as U.S. Treasury and
Federal agency securities. Securities represented 13 percent of total assets at December 31, 2008 compared with
12 percent at December 31, 2007. In 2008, total securities, which are almost entirely classified as available for
sale, increased $1.5 billion, or 8.8 percent. Growth was largely the result of securities purchased as a part of
Regions’ interest rate risk management activities. The “Interest Rate Risk” section, found later in this report,
further explains Regions’ interest rate risk management practices. The weighted-average yield earned on
securities, less equities, was 5.07 percent in 2008 and 5.03 percent in 2007. Table 11 “Securities” illustrates the
carrying values of securities by category.
Table 11—Securities
2008 2007 2006
(In thousands)
U.S. Treasury securities ........................ $ 900,303 $ 964,647 $ 400,065
Federal agency securities ....................... 1,705,686 3,329,656 3,752,216
Obligations of states and political subdivisions ...... 756,694 732,367 788,736
Mortgage-backed securities ..................... 14,349,342 11,092,758 12,777,358
Other debt securities ........................... 21,495 45,108 80,980
Equity securities .............................. 1,163,268 1,204,473 762,705
$18,896,788 $17,369,009 $18,562,060
54