Regions Bank 2008 Annual Report Download - page 158
Download and view the complete annual report
Please find page 158 of the 2008 Regions Bank annual report below. You can navigate through the pages in the report by either clicking on the pages listed below, or by using the keyword search tool below to find specific information within the annual report.-
 1
1 -
2
-
3
-
4
-
5
-
6
-
7
-
8
-
9
-
10
-
11
-
12
-
13
-
14
-
15
-
16
-
17
-
18
-
19
-
20
-
21
-
22
-
23
-
24
-
25
-
26
-
27
-
28
-
29
-
30
-
31
-
32
-
33
-
34
-
35
-
36
-
37
-
38
-
39
-
40
-
41
-
42
-
43
-
44
-
45
-
46
-
47
-
48
-
49
-
50
-
51
-
52
-
53
-
54
-
55
-
56
-
57
-
58
-
59
-
60
-
61
-
62
-
63
-
64
-
65
-
66
-
67
-
68
-
69
-
70
-
71
-
72
-
73
-
74
-
75
-
76
-
77
-
78
-
79
-
80
-
81
-
82
-
83
-
84
-
85
-
86
-
87
-
88
-
89
-
90
-
91
-
92
-
93
-
94
-
95
-
96
-
97
-
98
-
99
-
100
-
101
-
102
-
103
-
104
-
105
-
106
-
107
-
108
-
109
-
110
-
111
-
112
-
113
-
114
-
115
-
116
-
117
-
118
-
119
-
120
-
121
-
122
-
123
-
124
-
125
-
126
-
127
-
128
-
129
-
130
-
131
-
132
-
133
-
134
-
135
-
136
-
137
-
138
-
139
-
140
-
141
-
142
-
143
-
144
-
145
-
146
-
147
-
 148
148 -
 149
149 -
 150
150 -
 151
151 -
 152
152 -
 153
153 -
 154
154 -
 155
155 -
 156
156 -
 157
157 -
 158
158 -
 159
159 -
 160
160 -
 161
161 -
 162
162 -
 163
163 -
 164
164 -
 165
165 -
 166
166 -
 167
167 -
 168
168 -
169
-
170
-
171
-
172
-
173
-
174
-
175
-
176
-
177
-
178
-
179
-
180
-
181
-
182
-
183
-
184
 |
 |

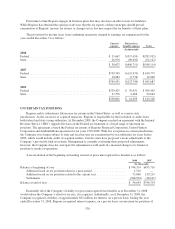
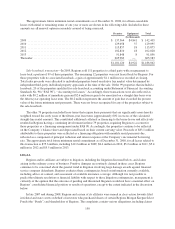
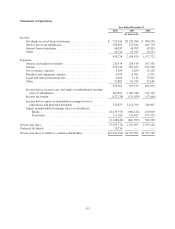
The following tables present financial information for each reportable segment for the years ended
December 31:
General
Banking/
Treasury
Investment
Banking/
Brokerage/
Trust Insurance
Merger
Charges and
Discontinued
Operations
Total
Company
(In thousands)
2008
Net interest income .................. $ 3,789,653 $ 49,308 $ 3,995 $ — $ 3,842,956
Provision for loan losses ............. 2,057,000 — — — 2,057,000
Non-interest income ................. 1,755,070 1,205,046 113,115 — 3,073,231
Goodwill impairment ................ 6,000,000 — — — 6,000,000
Other non-interest expense ............ 3,451,272 1,051,813 88,358 218,576 4,810,019
Income tax expense (benefit) .......... (354,934) 74,200 8,685 (83,009) (355,058)
Net income (loss) ............... $ (5,608,615) $ 128,341 $ 20,067 $ (135,567) $ (5,595,774)
Net income (loss) available to common
shareholders ..................... $ (5,634,851) $ 128,341 $ 20,067 $ (135,567) $ (5,622,010)
Average assets ..................... $139,984,321 $3,623,160 $339,544 $ — $143,947,025
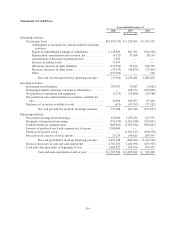
General
Banking/
Treasury
Investment
Banking/
Brokerage/
Trust Insurance
Merger
Charges and
Discontinued
Operations
Total
Company
(In thousands)
2007
Net interest income .................. $ 4,334,075 $ 58,402 $ 5,889 $ 11,968 $ 4,410,334
Provision for loan losses ............. 555,000 — — 182 555,182
Non-interest income ................. 1,601,306 1,151,181 103,348 (176,681) 2,679,154
Other non-interest expense ............ 3,279,453 947,673 82,358 403,359 4,712,843
Income tax expense (benefit) .......... 673,897 96,038 9,082 (208,649) 570,368
Net income (loss) ............... $ 1,427,031 $ 165,872 $ 17,797 $ (359,605) $ 1,251,095
Average assets ..................... $134,283,880 $3,717,596 $275,243 $ 479,900 $138,756,619
General
Banking/
Treasury
Investment
Banking/
Brokerage/
Trust Insurance
Merger
Charges and
Discontinued
Operations
Total
Company
(In thousands)
2006
Net interest income .................. $ 3,249,965 $ 52,699 $ 5,638 $ 45,140 $ 3,353,442
Provision for loan losses ............. 142,373 — — 127 142,500
Non-interest income ................. 1,055,845 888,926 84,949 32,384 2,062,104
Other non-interest expense ............ 2,347,629 702,913 64,827 198,662 3,314,031
Income tax expense (benefit) .......... 549,719 87,625 10,095 (41,569) 605,870
Net income (loss) ............... $ 1,266,089 $ 151,087 $ 15,665 $ (79,696) $ 1,353,145
Average assets ..................... $ 90,705,022 $3,314,361 $203,789 $1,577,105 $ 95,800,277
148