Regions Bank 2008 Annual Report Download - page 164
Download and view the complete annual report
Please find page 164 of the 2008 Regions Bank annual report below. You can navigate through the pages in the report by either clicking on the pages listed below, or by using the keyword search tool below to find specific information within the annual report.-
 1
1 -
2
-
3
-
4
-
5
-
6
-
7
-
8
-
9
-
10
-
11
-
12
-
13
-
14
-
15
-
16
-
17
-
18
-
19
-
20
-
21
-
22
-
23
-
24
-
25
-
26
-
27
-
28
-
29
-
30
-
31
-
32
-
33
-
34
-
35
-
36
-
37
-
38
-
39
-
40
-
41
-
42
-
43
-
44
-
45
-
46
-
47
-
48
-
49
-
50
-
51
-
52
-
53
-
54
-
55
-
56
-
57
-
58
-
59
-
60
-
61
-
62
-
63
-
64
-
65
-
66
-
67
-
68
-
69
-
70
-
71
-
72
-
73
-
74
-
75
-
76
-
77
-
78
-
79
-
80
-
81
-
82
-
83
-
84
-
85
-
86
-
87
-
88
-
89
-
90
-
91
-
92
-
93
-
94
-
95
-
96
-
97
-
98
-
99
-
100
-
101
-
102
-
103
-
104
-
105
-
106
-
107
-
108
-
109
-
110
-
111
-
112
-
113
-
114
-
115
-
116
-
117
-
118
-
119
-
120
-
121
-
122
-
123
-
124
-
125
-
126
-
127
-
128
-
129
-
130
-
131
-
132
-
133
-
134
-
135
-
136
-
137
-
138
-
139
-
140
-
141
-
142
-
143
-
144
-
145
-
146
-
147
-
148
-
149
-
150
-
151
-
152
-
153
-
 154
154 -
 155
155 -
 156
156 -
 157
157 -
 158
158 -
 159
159 -
 160
160 -
 161
161 -
 162
162 -
 163
163 -
 164
164 -
 165
165 -
 166
166 -
 167
167 -
 168
168 -
 169
169 -
 170
170 -
 171
171 -
 172
172 -
 173
173 -
 174
174 -
175
-
176
-
177
-
178
-
179
-
180
-
181
-
182
-
183
-
184
 |
 |

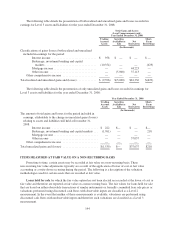
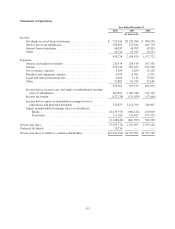
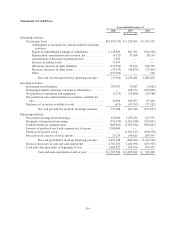
Statements of Cash Flows
Years Ended December 31
2008 2007 2006
(In thousands)
Operating activities:
Net income (loss) ..................................... $(5,595,774) $ 1,251,095 $ 1,353,145
Adjustments to reconcile net cash provided by operating
activities:
Equity in undistributed earnings of subsidiaries .......... 6,128,649 861,703 (564,338)
Depreciation, amortization and accretion, net ............ (4,552) 57,368 38,156
Amortization of discount on preferred stock ............ 3,382 — —
Increase in trading assets ............................ 17,654 — —
(Decrease) increase in other liabilities ................. (373,256) 31,194 292,762
Decrease (increase) in other assets .................... (76,335) (44,879) (33,407)
Other ........................................... (127,762) — 100
Net cash (used in) provided by operating activities . . . (27,994) 2,156,481 1,086,418
Investing activities:
Investment in subsidiaries ............................... 305,387 13,687 (9,682)
Principal payments (advances) on loans to subsidiaries ........ — 124,375 (100,000)
Net purchases of premises and equipment .................. (1,714) (53,868) (24,786)
Proceeds from sales and maturities of securities available for
sale ............................................... 34,966 109,057 87,426
Purchases of securities available for sale ................... (651) (87,305) (77,985)
Net cash provided by (used in) investing activities . . . 337,988 105,946 (125,027)
Financing activities:
Proceeds from long-term borrowings ...................... 345,000 3,135,439 227,575
Payments on long-term borrowings ....................... (751,470) (1,691,638) (524,051)
Cash dividends on common stock ......................... (669,001) (1,035,432) (894,805)
Issuance of preferred stock and common stock warrant ........ 3,500,000 — —
Purchase of treasury stock ............................... — (1,363,213) (490,370)
Proceeds from exercise of stock options .................... 27,179 154,813 264,335
Net cash provided by (used in) financing activities . . . 2,451,708 (800,031) (1,417,316)
Increase (decrease) in cash and cash equivalents ............. 2,761,702 1,462,396 (455,925)
Cash and cash equivalents at beginning of year .............. 2,005,822 543,426 999,351
Cash and cash equivalents at end of year ........... $4,767,524 $ 2,005,822 $ 543,426
154