Regions Bank 2008 Annual Report Download - page 56
Download and view the complete annual report
Please find page 56 of the 2008 Regions Bank annual report below. You can navigate through the pages in the report by either clicking on the pages listed below, or by using the keyword search tool below to find specific information within the annual report.-
 1
1 -
2
-
3
-
4
-
5
-
6
-
7
-
8
-
9
-
10
-
11
-
12
-
13
-
14
-
15
-
16
-
17
-
18
-
19
-
20
-
21
-
22
-
23
-
24
-
25
-
26
-
27
-
28
-
29
-
30
-
31
-
32
-
33
-
34
-
35
-
36
-
37
-
38
-
39
-
40
-
41
-
42
-
43
-
44
-
45
-
 46
46 -
 47
47 -
 48
48 -
 49
49 -
 50
50 -
 51
51 -
 52
52 -
 53
53 -
 54
54 -
 55
55 -
 56
56 -
 57
57 -
 58
58 -
 59
59 -
 60
60 -
 61
61 -
 62
62 -
 63
63 -
 64
64 -
 65
65 -
 66
66 -
67
-
68
-
69
-
70
-
71
-
72
-
73
-
74
-
75
-
76
-
77
-
78
-
79
-
80
-
81
-
82
-
83
-
84
-
85
-
86
-
87
-
88
-
89
-
90
-
91
-
92
-
93
-
94
-
95
-
96
-
97
-
98
-
99
-
100
-
101
-
102
-
103
-
104
-
105
-
106
-
107
-
108
-
109
-
110
-
111
-
112
-
113
-
114
-
115
-
116
-
117
-
118
-
119
-
120
-
121
-
122
-
123
-
124
-
125
-
126
-
127
-
128
-
129
-
130
-
131
-
132
-
133
-
134
-
135
-
136
-
137
-
138
-
139
-
140
-
141
-
142
-
143
-
144
-
145
-
146
-
147
-
148
-
149
-
150
-
151
-
152
-
153
-
154
-
155
-
156
-
157
-
158
-
159
-
160
-
161
-
162
-
163
-
164
-
165
-
166
-
167
-
168
-
169
-
170
-
171
-
172
-
173
-
174
-
175
-
176
-
177
-
178
-
179
-
180
-
181
-
182
-
183
-
184
 |
 |
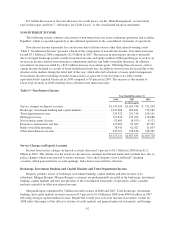
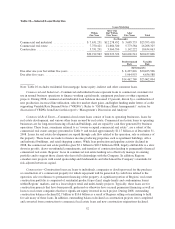
NON-INTEREST EXPENSE
The following section contains a discussion of non-interest expense from continuing operations. The largest
components of non-interest expense are salaries and employee benefits, net occupancy expense and furniture and
equipment expense. Total non-interest expense for 2008 also includes a $6.0 billion non-cash goodwill
impairment charge. Non-interest expense, excluding the merger-related and goodwill impairment charges,
increased $282.0 million, or 6.5 percent, to $4.6 billion in 2008. Included in non-interest expense are pre-tax
merger-related expenses totaling $200.2 million in 2008 and $350.9 million in 2007.
Table 8 “Non-Interest Expense (including Non-GAAP reconciliation)” presents major non-interest expense
components, both including and excluding merger-related expenses and goodwill impairment, for the years ended
December 31, 2008, 2007 and 2006. Management believes Table 8 is useful in evaluating trends in non-interest
expense. Note that merger-related charges as shown in this table relate to Regions’ acquisition of AmSouth in
November 2006. See Table 2 “GAAP to Non-GAAP Reconciliation,” and the text preceding it, for further
discussion of non-GAAP financial measures.
46