Regions Bank 2008 Annual Report Download - page 121
Download and view the complete annual report
Please find page 121 of the 2008 Regions Bank annual report below. You can navigate through the pages in the report by either clicking on the pages listed below, or by using the keyword search tool below to find specific information within the annual report.-
 1
1 -
2
-
3
-
4
-
5
-
6
-
7
-
8
-
9
-
10
-
11
-
12
-
13
-
14
-
15
-
16
-
17
-
18
-
19
-
20
-
21
-
22
-
23
-
24
-
25
-
26
-
27
-
28
-
29
-
30
-
31
-
32
-
33
-
34
-
35
-
36
-
37
-
38
-
39
-
40
-
41
-
42
-
43
-
44
-
45
-
46
-
47
-
48
-
49
-
50
-
51
-
52
-
53
-
54
-
55
-
56
-
57
-
58
-
59
-
60
-
61
-
62
-
63
-
64
-
65
-
66
-
67
-
68
-
69
-
70
-
71
-
72
-
73
-
74
-
75
-
76
-
77
-
78
-
79
-
80
-
81
-
82
-
83
-
84
-
85
-
86
-
87
-
88
-
89
-
90
-
91
-
92
-
93
-
94
-
95
-
96
-
97
-
98
-
99
-
100
-
101
-
102
-
103
-
104
-
105
-
106
-
107
-
108
-
109
-
110
-
 111
111 -
 112
112 -
 113
113 -
 114
114 -
 115
115 -
 116
116 -
 117
117 -
 118
118 -
 119
119 -
 120
120 -
 121
121 -
 122
122 -
 123
123 -
 124
124 -
 125
125 -
 126
126 -
 127
127 -
 128
128 -
 129
129 -
 130
130 -
 131
131 -
132
-
133
-
134
-
135
-
136
-
137
-
138
-
139
-
140
-
141
-
142
-
143
-
144
-
145
-
146
-
147
-
148
-
149
-
150
-
151
-
152
-
153
-
154
-
155
-
156
-
157
-
158
-
159
-
160
-
161
-
162
-
163
-
164
-
165
-
166
-
167
-
168
-
169
-
170
-
171
-
172
-
173
-
174
-
175
-
176
-
177
-
178
-
179
-
180
-
181
-
182
-
183
-
184
 |
 |

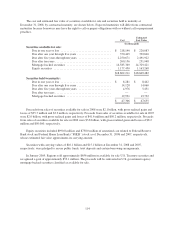
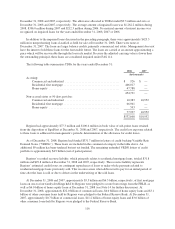
ASSETS HELD FOR SALE
In February 2007, Regions listed more than 100 branch and land properties for sale related to the AmSouth
merger. These properties exist in areas where the merger created an overlapping presence. During 2008,
additional properties were listed for sale. Regions classified these properties as held for sale at December 31,
2008 and 2007 in other assets on the balance sheet. During 2008 and 2007, Regions sold approximately $43.9
million and $35.4 million, respectively, of properties recorded as held for sale. A net gain of approximately $5.3
million and $32.7 million was recognized in other non-interest expense from continuing operations on the
consolidated statements of operations during the years ended December 31, 2008 and 2007, respectively.
BRANCH DIVESTITURES
During the first quarter of 2007, Regions completed the divestiture of 52 former AmSouth branches. These
divestitures were required by the Department of Justice and Board of Governors of the Federal Reserve in
markets where the merger may have affected competition. The premium received from the divestitures is
reflected in goodwill.
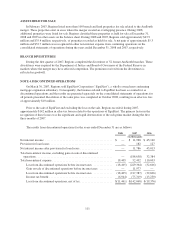
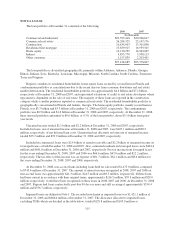
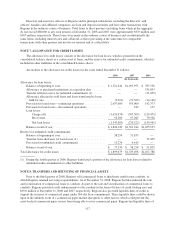
NOTE 4. DISCONTINUED OPERATIONS
On March 30, 2007, Regions sold EquiFirst Corporation (“EquiFirst”), a wholly owned non-conforming
mortgage origination subsidiary. Consequently, the business related to EquiFirst has been accounted for as
discontinued operations and the results are presented separately on the consolidated statements of operations for
all periods presented. Resolution of the sales price was completed in October 2008, resulting in an after-tax loss
of approximately $10 million.
Prior to the sale of EquiFirst and excluding the loss on the sale, Regions recorded, during 2007,
approximately $142 million in after-tax losses related to the operations of EquiFirst. The primary factor in the
recognition of these losses was the significant and rapid deterioration of the sub-prime market during the first
three months of 2007.
The results from discontinued operations for the years ended December 31 are as follows:
2008 2007 2006
(In thousands)
Net interest income .............................................. $ — $ 11,968 $ 45,140
Provision for loan losses .......................................... — 182 127
Net interest income after provision for loan losses ...................... — 11,786 45,013
Total non-interest income, excluding gain on sale of discontinued
operations .................................................... — (188,658) 32,384
Total non-interest expense ......................................... 18,405 52,492 110,003
Loss from discontinued operations before income taxes ............. (18,405) (229,364) (32,606)
Gain on sale of discontinued operations before income taxes ......... — 11,977 —
Loss from discontinued operations before income taxes ............. (18,405) (217,387) (32,606)
Income tax benefit ........................................... (6,944) (75,319) (13,230)
Loss from discontinued operations, net of tax ...................... $(11,461) $(142,068) $ (19,376)
111