Regions Bank 2008 Annual Report Download - page 53
Download and view the complete annual report
Please find page 53 of the 2008 Regions Bank annual report below. You can navigate through the pages in the report by either clicking on the pages listed below, or by using the keyword search tool below to find specific information within the annual report.-
 1
1 -
2
-
3
-
4
-
5
-
6
-
7
-
8
-
9
-
10
-
11
-
12
-
13
-
14
-
15
-
16
-
17
-
18
-
19
-
20
-
21
-
22
-
23
-
24
-
25
-
26
-
27
-
28
-
29
-
30
-
31
-
32
-
33
-
34
-
35
-
36
-
37
-
38
-
39
-
40
-
41
-
42
-
 43
43 -
 44
44 -
 45
45 -
 46
46 -
 47
47 -
 48
48 -
 49
49 -
 50
50 -
 51
51 -
 52
52 -
 53
53 -
 54
54 -
 55
55 -
 56
56 -
 57
57 -
 58
58 -
 59
59 -
 60
60 -
 61
61 -
 62
62 -
 63
63 -
64
-
65
-
66
-
67
-
68
-
69
-
70
-
71
-
72
-
73
-
74
-
75
-
76
-
77
-
78
-
79
-
80
-
81
-
82
-
83
-
84
-
85
-
86
-
87
-
88
-
89
-
90
-
91
-
92
-
93
-
94
-
95
-
96
-
97
-
98
-
99
-
100
-
101
-
102
-
103
-
104
-
105
-
106
-
107
-
108
-
109
-
110
-
111
-
112
-
113
-
114
-
115
-
116
-
117
-
118
-
119
-
120
-
121
-
122
-
123
-
124
-
125
-
126
-
127
-
128
-
129
-
130
-
131
-
132
-
133
-
134
-
135
-
136
-
137
-
138
-
139
-
140
-
141
-
142
-
143
-
144
-
145
-
146
-
147
-
148
-
149
-
150
-
151
-
152
-
153
-
154
-
155
-
156
-
157
-
158
-
159
-
160
-
161
-
162
-
163
-
164
-
165
-
166
-
167
-
168
-
169
-
170
-
171
-
172
-
173
-
174
-
175
-
176
-
177
-
178
-
179
-
180
-
181
-
182
-
183
-
184
 |
 |
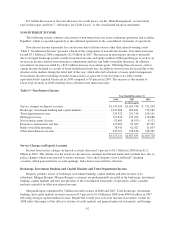
markets. In addition, private client revenues were influenced by a reluctance of retail investors to make
investment decisions in the market, due to increasing unemployment, declining property values, and declining
personal wealth. As a result, brokerage, investment banking, and capital markets income began to decline during
the latter part of 2008. Higher revenues from Morgan Keegan’s fixed income business offset this decrease to
some extent, however, as institutional investors seeking safety invested heavily in municipal, mortgage-backed,
and treasury securities. As of December 31, 2008, Morgan Keegan employed approximately 1,285 financial
advisors. Customer and trust assets under management were approximately $63 billion and $62 billion,
respectively, at year-end 2008 compared to approximately $80 billion and $81 billion, respectively, at year-end
2007. The reduction in assets under management is primarily driven by lower asset valuations from declining
markets during the year.
Revenues from the private client division, which were affected by market disarray, declined 14 percent to
$339.4 million, or 26 percent of Morgan Keegan’s total revenue in 2008 compared to $393.5 million or 30
percent in 2007. Fixed-income capital markets revenues were up in 2008, totaling $369.9 million, as compared to
$244.4 million in 2007, the result of higher trading volumes due to investors change in preference to safe-haven
investments, including treasuries and highly rated municipal securities. Equity markets revenue was solid early in
2008, but increasingly gave way to financial market turmoil as the capital markets became more dislocated.
Equity capital markets revenues totaled $127.9 million in 2008, compared to $103.3 million in 2007. Trust
revenues increased 2 percent to $230.6 million in 2008, driven higher by revenues generated from the negotiation
of natural lease drilling rights on customer properties. The asset management division produced $177.4 million
of revenue in 2008 compared to $188.9 million in 2007 and was pressured by the decreasing value of managed
assets during the year.
Morgan Keegan’s pre-tax income was negatively affected during 2008 by $49.4 million in losses on
investments in two open-end mutual funds managed by Morgan Keegan. These losses totaled $42.8 million in
2007. The Company, through Morgan Keegan, purchased fund shares in order to provide liquidity to the funds.
The carrying value of these investments, which is equal to their estimated market value, was approximately $8.4
million as of December 31, 2008. Professional fees, primarily legal costs, also increased at Morgan Keegan from
$21.1 million in 2007 to $85.5 million in 2008.
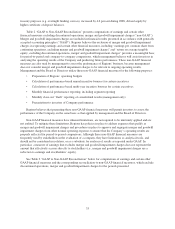
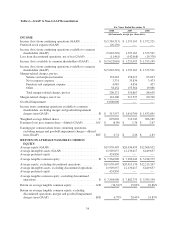
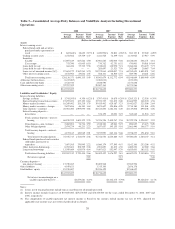
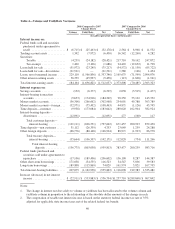
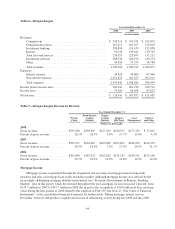
Table 6 “Morgan Keegan” details the components of Morgan Keegan’s contribution to the Company’s
revenue and earnings for the years ended December 31, 2008, 2007 and 2006. Table 7 “Morgan Keegan Revenue
by Division” illustrates Morgan Keegan’s revenues by division for the years ended December 31, 2008, 2007 and
2006.
43