Regions Bank 2008 Annual Report Download - page 44
Download and view the complete annual report
Please find page 44 of the 2008 Regions Bank annual report below. You can navigate through the pages in the report by either clicking on the pages listed below, or by using the keyword search tool below to find specific information within the annual report.-
 1
1 -
2
-
3
-
4
-
5
-
6
-
7
-
8
-
9
-
10
-
11
-
12
-
13
-
14
-
15
-
16
-
17
-
18
-
19
-
20
-
21
-
22
-
23
-
24
-
25
-
26
-
27
-
28
-
29
-
30
-
31
-
32
-
33
-
 34
34 -
 35
35 -
 36
36 -
 37
37 -
 38
38 -
 39
39 -
 40
40 -
 41
41 -
 42
42 -
 43
43 -
 44
44 -
 45
45 -
 46
46 -
 47
47 -
 48
48 -
 49
49 -
 50
50 -
 51
51 -
 52
52 -
 53
53 -
 54
54 -
55
-
56
-
57
-
58
-
59
-
60
-
61
-
62
-
63
-
64
-
65
-
66
-
67
-
68
-
69
-
70
-
71
-
72
-
73
-
74
-
75
-
76
-
77
-
78
-
79
-
80
-
81
-
82
-
83
-
84
-
85
-
86
-
87
-
88
-
89
-
90
-
91
-
92
-
93
-
94
-
95
-
96
-
97
-
98
-
99
-
100
-
101
-
102
-
103
-
104
-
105
-
106
-
107
-
108
-
109
-
110
-
111
-
112
-
113
-
114
-
115
-
116
-
117
-
118
-
119
-
120
-
121
-
122
-
123
-
124
-
125
-
126
-
127
-
128
-
129
-
130
-
131
-
132
-
133
-
134
-
135
-
136
-
137
-
138
-
139
-
140
-
141
-
142
-
143
-
144
-
145
-
146
-
147
-
148
-
149
-
150
-
151
-
152
-
153
-
154
-
155
-
156
-
157
-
158
-
159
-
160
-
161
-
162
-
163
-
164
-
165
-
166
-
167
-
168
-
169
-
170
-
171
-
172
-
173
-
174
-
175
-
176
-
177
-
178
-
179
-
180
-
181
-
182
-
183
-
184
 |
 |

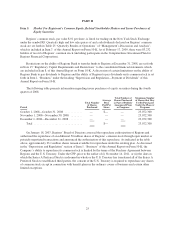
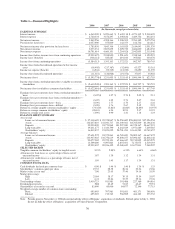
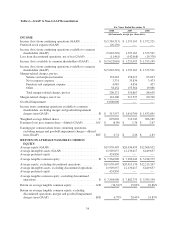
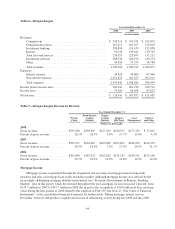
Table 2—GAAP to Non-GAAP Reconciliation
For Years Ended December 31
2008 2007 2006
(In thousands, except per share data)
INCOME
Income (loss) from continuing operations (GAAP) ........... $(5,584,313) $ 1,393,163 $ 1,372,521
Preferred stock expense (GAAP) ......................... (26,236) — —
Income (loss) from continuing operations available to common
shareholders (GAAP) ................................ (5,610,549) 1,393,163 1,372,521
Loss from discontinued operations, net of tax (GAAP) ........ (11,461) (142,068) (19,376)
Income (loss) available to common shareholders (GAAP) ..... A $(5,622,010) $ 1,251,095 $ 1,353,145
Income (loss) from continuing operations available to common
shareholders (GAAP) ................................ $(5,610,549) $ 1,393,163 $ 1,372,521
Merger-related charges, pre-tax
Salaries and employee benefits ...................... 133,401 158,613 65,693
Net occupancy expense ............................ 3,331 33,834 3,473
Furniture and equipment expense ..................... 4,985 4,856 427
Other ........................................... 58,454 153,564 19,066
Total merger-related charges, pre-tax ................. 200,171 350,867 88,659
Merger-related charges, net of tax ........................ 124,106 217,537 60,320
Goodwill impairment .................................. 6,000,000 — —
Income from continuing operations available to common
shareholders, excluding merger and goodwill impairment
charges (non-GAAP) ................................ B $ 513,557 $ 1,610,700 $ 1,432,841
Weighted-average diluted shares ......................... C 695,003 712,743 506,989
Earnings (loss) per common share – diluted (GAAP) .........A/C $ (8.09) $ 1.76 $ 2.67
Earnings per common share from continuing operations,
excluding merger and goodwill impairment charges—diluted
(non-GAAP) .......................................B/C $ 0.74 $ 2.26 $ 2.83
RETURN ON AVERAGE TANGIBLE COMMON
EQUITY
Average equity (GAAP) ................................ $19,939,407 $20,036,459 $12,368,632
Average intangible assets (GAAP) ........................ 11,949,657 12,130,417 6,449,657
Average preferred equity ............................... 424,850 — —
Average tangible common equity ......................... D $ 7,564,900 $ 7,906,042 $ 5,918,975
Average equity, excluding discontinued operations .......... $19,939,407 $20,013,170 $12,215,207
Average intangible assets, excluding discontinued operations . . 11,949,657 12,130,417 6,449,657
Average preferred equity ............................... 424,850 — —
Average tangible common equity, excluding discontinued
operations ......................................... E $ 7,564,900 $ 7,882,753 $ 5,765,550
Return on average tangible common equity .................A/D (74.32)% 15.82% 22.86%
Return on average tangible common equity, excluding
discontinued operations, merger and goodwill impairment
charges (non-GAAP) ................................B/E 6.79% 20.43% 24.85%
34