Regions Bank 2008 Annual Report Download - page 157
Download and view the complete annual report
Please find page 157 of the 2008 Regions Bank annual report below. You can navigate through the pages in the report by either clicking on the pages listed below, or by using the keyword search tool below to find specific information within the annual report.-
 1
1 -
2
-
3
-
4
-
5
-
6
-
7
-
8
-
9
-
10
-
11
-
12
-
13
-
14
-
15
-
16
-
17
-
18
-
19
-
20
-
21
-
22
-
23
-
24
-
25
-
26
-
27
-
28
-
29
-
30
-
31
-
32
-
33
-
34
-
35
-
36
-
37
-
38
-
39
-
40
-
41
-
42
-
43
-
44
-
45
-
46
-
47
-
48
-
49
-
50
-
51
-
52
-
53
-
54
-
55
-
56
-
57
-
58
-
59
-
60
-
61
-
62
-
63
-
64
-
65
-
66
-
67
-
68
-
69
-
70
-
71
-
72
-
73
-
74
-
75
-
76
-
77
-
78
-
79
-
80
-
81
-
82
-
83
-
84
-
85
-
86
-
87
-
88
-
89
-
90
-
91
-
92
-
93
-
94
-
95
-
96
-
97
-
98
-
99
-
100
-
101
-
102
-
103
-
104
-
105
-
106
-
107
-
108
-
109
-
110
-
111
-
112
-
113
-
114
-
115
-
116
-
117
-
118
-
119
-
120
-
121
-
122
-
123
-
124
-
125
-
126
-
127
-
128
-
129
-
130
-
131
-
132
-
133
-
134
-
135
-
136
-
137
-
138
-
139
-
140
-
141
-
142
-
143
-
144
-
145
-
146
-
 147
147 -
 148
148 -
 149
149 -
 150
150 -
 151
151 -
 152
152 -
 153
153 -
 154
154 -
 155
155 -
 156
156 -
 157
157 -
 158
158 -
 159
159 -
 160
160 -
 161
161 -
 162
162 -
 163
163 -
 164
164 -
 165
165 -
 166
166 -
 167
167 -
168
-
169
-
170
-
171
-
172
-
173
-
174
-
175
-
176
-
177
-
178
-
179
-
180
-
181
-
182
-
183
-
184
 |
 |

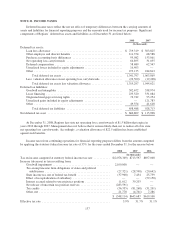
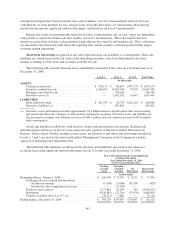
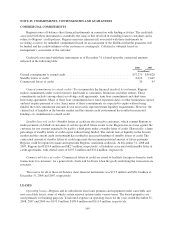
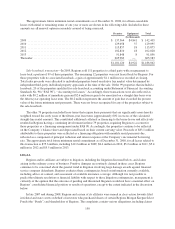
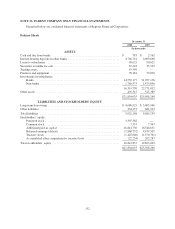
The estimated fair values of the Company’s financial instruments as of December 31, 2008 are consistent
with the exit price concept under FAS 157. The carrying amounts and estimated fair values of the Company’s
financial instruments as of December 31 are as follows:
2008 2007
Carrying
Amount
Estimated
Fair Value
Carrying
Amount
Estimated
Fair Value
(In thousands)
Financial assets:
Cash and cash equivalents .................. $10,972,393 $10,972,393 $ 4,745,141 $ 4,745,141
Trading account assets .................... 1,050,270 1,050,270 1,091,400 1,091,400
Securities available for sale ................. 18,849,482 18,849,482 17,318,074 17,318,074
Securities held to maturity ................. 47,306 47,655 50,935 51,790
Loans held for sale ....................... 1,282,437 1,282,437 720,924 730,859
Loans, net (excluding leases) ............... 94,888,010 79,882,414 93,028,223 93,107,611
Other interest-earning assets ................ 896,906 896,906 504,614 504,614
Derivative assets ......................... 1,897,499 1,897,499 841,795 841,795
Financial liabilities:
Deposits ................................ 90,903,890 91,198,585 94,774,968 86,429,028
Short-term borrowings .................... 15,821,962 15,821,962 11,120,122 11,120,122
Long-term borrowings ..................... 19,231,277 18,190,958 11,324,790 11,025,457
Derivative liabilities ...................... 895,841 895,841 513,969 513,969
Loan commitments and letters of credit ....... 108,722 732,363 75,030 408,382
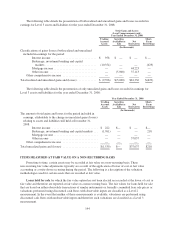
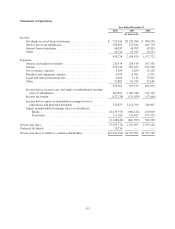
NOTE 24. BUSINESS SEGMENT INFORMATION
Regions’ segment information is presented based on Regions’ key segments of business. Each segment is a
strategic business unit that serves specific needs of Regions’ customers. The Company’s primary segment is
General Banking/Treasury, which represents the Company’s branch network, including consumer and
commercial banking functions, and has separate management that is responsible for the operation of that business
unit. This segment also includes the Company’s Treasury function, including the Company’s securities portfolio
and other wholesale funding activities. Prior to year-end 2008, Regions had reported an Other segment that
included merger charges and the parent company. Regions realigned to include the parent company with General
Banking/Treasury as parent company transactions essentially support the Treasury function. The remaining
merger charges were combined with discontinued operations because management reviews the results of the
reportable segments excluding these items. The 2007 and 2006 amounts presented below have been adjusted to
conform to the current presentation.
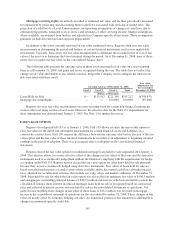
In addition to General Banking/Treasury, Regions has designated as distinct reportable segments the activity
of its Investment Banking/Brokerage/Trust and Insurance divisions. Investment Banking/Brokerage/Trust
includes trust activities and all brokerage and investment activities associated with Morgan Keegan. Insurance
includes all business associated with commercial insurance and credit life products sold to consumer customers.
The reportable segment designated Merger Charges and Discontinued Operations includes merger charges
related to the AmSouth acquisition and the results of EquiFirst for the periods presented.
147