Regions Bank 2008 Annual Report Download - page 61
Download and view the complete annual report
Please find page 61 of the 2008 Regions Bank annual report below. You can navigate through the pages in the report by either clicking on the pages listed below, or by using the keyword search tool below to find specific information within the annual report.-
 1
1 -
2
-
3
-
4
-
5
-
6
-
7
-
8
-
9
-
10
-
11
-
12
-
13
-
14
-
15
-
16
-
17
-
18
-
19
-
20
-
21
-
22
-
23
-
24
-
25
-
26
-
27
-
28
-
29
-
30
-
31
-
32
-
33
-
34
-
35
-
36
-
37
-
38
-
39
-
40
-
41
-
42
-
43
-
44
-
45
-
46
-
47
-
48
-
49
-
50
-
 51
51 -
 52
52 -
 53
53 -
 54
54 -
 55
55 -
 56
56 -
 57
57 -
 58
58 -
 59
59 -
 60
60 -
 61
61 -
 62
62 -
 63
63 -
 64
64 -
 65
65 -
 66
66 -
 67
67 -
 68
68 -
 69
69 -
 70
70 -
 71
71 -
72
-
73
-
74
-
75
-
76
-
77
-
78
-
79
-
80
-
81
-
82
-
83
-
84
-
85
-
86
-
87
-
88
-
89
-
90
-
91
-
92
-
93
-
94
-
95
-
96
-
97
-
98
-
99
-
100
-
101
-
102
-
103
-
104
-
105
-
106
-
107
-
108
-
109
-
110
-
111
-
112
-
113
-
114
-
115
-
116
-
117
-
118
-
119
-
120
-
121
-
122
-
123
-
124
-
125
-
126
-
127
-
128
-
129
-
130
-
131
-
132
-
133
-
134
-
135
-
136
-
137
-
138
-
139
-
140
-
141
-
142
-
143
-
144
-
145
-
146
-
147
-
148
-
149
-
150
-
151
-
152
-
153
-
154
-
155
-
156
-
157
-
158
-
159
-
160
-
161
-
162
-
163
-
164
-
165
-
166
-
167
-
168
-
169
-
170
-
171
-
172
-
173
-
174
-
175
-
176
-
177
-
178
-
179
-
180
-
181
-
182
-
183
-
184
 |
 |

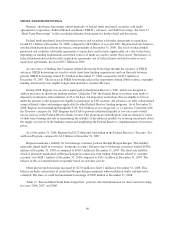
Company’s effective tax rate, if recognized. As of December 31, 2008, the Company recognized a liability of
approximately $31 million for interest, on a pre-tax basis. During the year ended December 31, 2008, Regions
recognized interest expense, on a pre-tax basis, on uncertain tax positions of approximately $39 million.
See Note 1 “Summary of Significant Accounting Policies” and Note 21 “Income Taxes” to the consolidated
financial statements for additional information about the provision for income taxes.
BALANCE SHEET ANALYSIS
At December 31, 2008, Regions reported total assets of $146.2 billion compared to $141.0 billion at the end
of 2007, an increase of approximately $5.2 billion or 3.7 percent. The balance sheet growth reflects an increase in
loans outstanding, primarily commercial and industrial and home equity balances, as well as an increase in
interest-bearing deposits in other banks, primarily the Federal Reserve Bank.Offsetting these growth drivers,
Regions’ assets were reduced by the goodwill impairment charge taken during the fourth quarter of 2008.
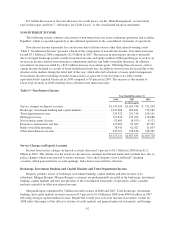
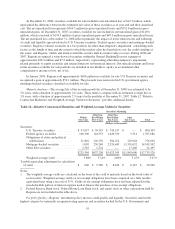
Loans
Average loans, net of unearned income, represented 81 percent of average interest-earning assets at
December 31, 2008. Lending at Regions is generally organized along three functional lines: commercial and
industrial loans (including financial and agricultural), real estate loans (commercial mortgage and construction
loans) and consumer loans (residential first mortgage, home equity, indirect and other consumer loans). The
composition of the portfolio by these major categories is presented in Table 9 “Loan Portfolio.”
Regions manages loan growth with a focus on risk management and risk adjusted return on capital. Total
loans, net of unearned income, increased at a relatively slow pace during 2008. A challenging economic
environment, particularly in the real estate sector, was the primary factor leading to the modest growth. Regions
is continuing to make credit available to consumers, small businesses and commercial companies as intended by
Treasury and the Congress in establishing the government investment in banks (See “Stockholders’ Equity”
section found later in this report). During the fourth quarter of 2008, the government’s investment of $3.5 billion
strengthened Regions’ regulatory capital, which supported origination of approximately $16.5 billion in new and
renewed loans and lines, including unfunded commitments. This lending production was during an economic
environment when lending is typically flat or reduced.
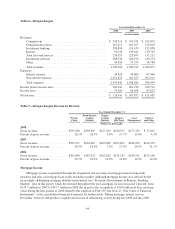
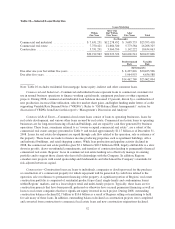
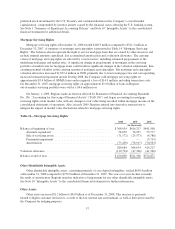
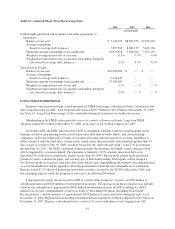
Table 9 shows a year-over-year comparison of loans by loan type.
Table 9—Loan Portfolio
2008 2007 2006 2005 2004
(In thousands, net of unearned income)
Commercial and industrial ......... $23,595,418 $20,906,617 $24,145,411 $14,728,006 $15,028,015
Commercial real estate (1) ......... 26,208,325 23,107,176 19,646,423 24,773,539 26,059,454
Construction .................... 10,634,063 13,301,898 14,121,030 7,362,219 5,472,463
Residential first mortgage (1) ....... 15,839,015 16,959,545 15,583,920 n/a n/a
Home equity .................... 16,130,255 14,962,007 14,888,599 7,794,684 6,634,487
Indirect ........................ 3,853,770 3,938,113 4,037,539 1,353,929 1,641,629
Other consumer .................. 1,157,839 2,203,491 2,127,680 2,392,536 2,690,906
$97,418,685 $95,378,847 $94,550,602 $58,404,913 $57,526,954
(1) Breakout of residential first mortgage not available for 2005 and 2004 due to the AmSouth merger;
residential first mortgage is included in commercial real estate for 2005 and 2004.
51